Pull up one Fibonacci tool. Anchor it to the last swing. Watch price stop at 61.8%, and call that The Level. Then a week later the chart does the same thing twenty dollars lower, nowhere near that line. And you swear off Fibonacci.
The issue isn't the tool. It's the count of one.
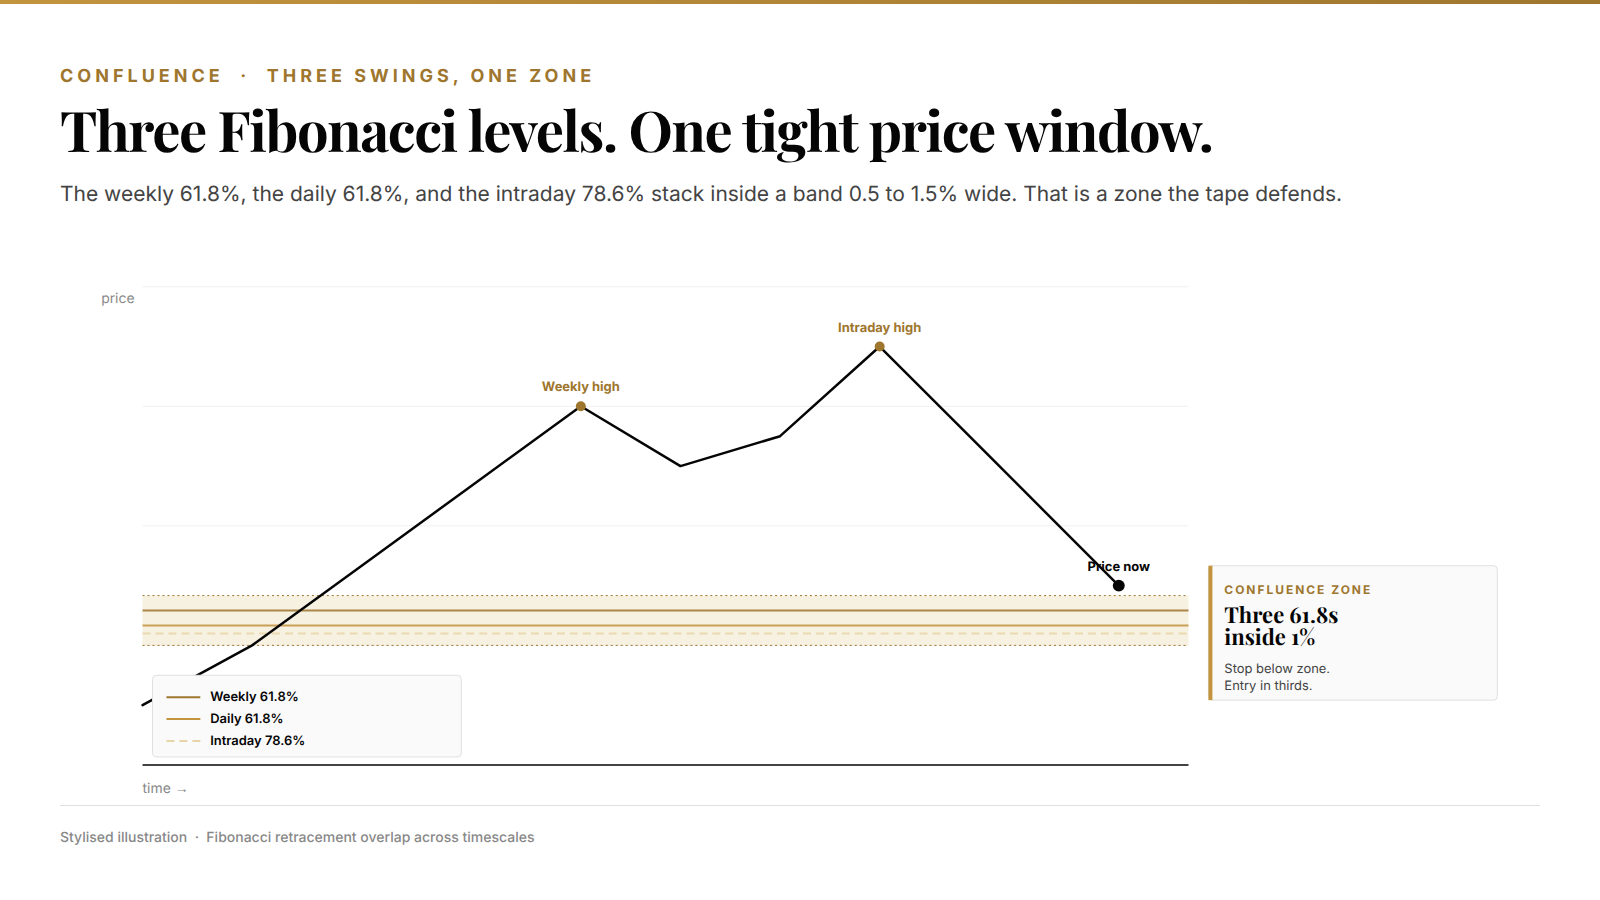
A confluence zone is what you get when three Fibonacci levels from different swings land inside the same price window. That window is where real entries sit. One line is a suggestion. Three lines is a meeting point. The tape respects meeting points.
This is the framework we use inside Kunkel Capital Research when a chart looks ready to retrace and we need to decide how deep to let it run before the setup invalidates. The framework is simple. The discipline isn't.
Single Fibonacci lines fail because markets have memory
One swing high and one swing low is the smallest possible sample. Price rarely reacts to a single level for long. A weekly swing, a daily swing, a four-hour swing, each one draws a different set of lines, and each one carries different memory.
When those sets overlap, the overlap has more memory than any line alone. It's the Fibonacci version of a former high that's also an earnings cluster that's also the 200-day moving average. Multiple independent reasons to buy or sell, stacked inside the same few bucks of price.
And confluence isn't a mystical idea. It's statistics. If your edge on a single fib level is 55%, and a second independent fib level in the same zone is also 55%, the two together nudge the probability higher than either alone, and when a third independent level from a different timescale joins them in the same tight price window the math stops being a polite nudge and starts justifying a trade. Not double. Not 110%. But enough to change what size makes sense. That's the whole game.
Four retracements and two extensions. That's it
You don't need the full Fibonacci grid. Most traders plot ten lines and their chart turns into a ladder of noise. Four retracement levels earn the screen space, and two extensions.
- 38.2%, shallow retrace in a strong trend. Wave 2 rarely sits here in equities. When it does, the follow-through move tends to be smaller. - 50%, not a true Fibonacci number but a psychological magnet. Halfway is a round place to flip bias. - 61.8%, the golden ratio itself. The deepest retrace most impulse moves accept before the trend breaks. - 78.6%, the outer edge of a valid retracement. Past this you usually lose the trend. - 1.272×, common wave 5 and C-wave target. - 1.618×, standard wave 3 extension, where the meat of a move prints.
Ignore 23.6%. Ignore anything past 78.6%. They're noise. The rest is enough.
Building a confluence zone from three swings
Here's the mechanical version. On the chart you're watching, find three clean swings at different timescales.
First, a daily swing. Take the most recent confirmed high to low (or low to high) on the daily. Second, a weekly swing. The dominant swing that frames the current trend on the weekly. Third, an intraday swing. The most recent reaction swing on the four-hour or one-hour, depending on what you're trading.
Drop a Fibonacci retracement on each. Don't worry about pixel-perfect anchors. Plant them at the obvious pivots. Now look at where the 61.8% lines cluster. If the three 61.8s sit inside a tight price window, that's a zone. If they're spread across the chart, this swing doesn't offer confluence and you wait for the next one.
A real zone is usually 0.5 to 1.5% of price wide on equities and indices, tighter on futures, wider on crypto. Wider than 2% and you're looking at wishful alignment. Under 1% on a daily chart and you've got a zone the tape will defend.
The golden pocket is not marketing
The range between 61.8% and 78.6% on the deepest swing usually gets called the golden pocket. Sounds like a marketing phrase. The reason it sticks isn't branding. It's that that pocket is where the trend either holds or dies, and traders on both sides know it.
Price that breaks hard off the golden pocket tends to make new highs. Price that grinds sideways inside it for more than a handful of candles usually breaks the pocket to the downside. The pocket is the decision point.
So when I size a retracement trade, my base case is that price dips into the golden pocket on the dominant swing and bounces. If the pocket also overlaps the 61.8% of the intraday swing plus the prior breakout level plus a round dollar number, I'd take a full-size position. If it's just the pocket alone with nothing else confirming, I'd cut size in half.
Look at any strong trending market in the last decade. SPX out of the 2020 low. Gold out of the 2022 basing. Bitcoin through every bull phase since 2017. The deepest acceptable retracements in trending legs cluster inside 61.8 to 78.6. Not always. Often enough that it's the first place I look.
Entry, stop, invalidation. The mechanical framework
A confluence zone is a zone, not a line. So you can't just limit-order the top of it and hope.
Entry. Split your entry into thirds. First third goes limit at the top of the zone. Second third fills in the middle. Third third fills at the bottom. If price only tags the top and rips, you're in on a third. If price runs the whole zone, you're in at the average of the three fills.
Stop. Park the stop below the bottom of the zone with some air: 2 to 5% below on equities, 0.8 to 1.5% on futures, 4 to 7% on crypto. Not right under the zone. Below the last swing pivot that made the zone matter in the first place. You're letting the zone work, not the line.
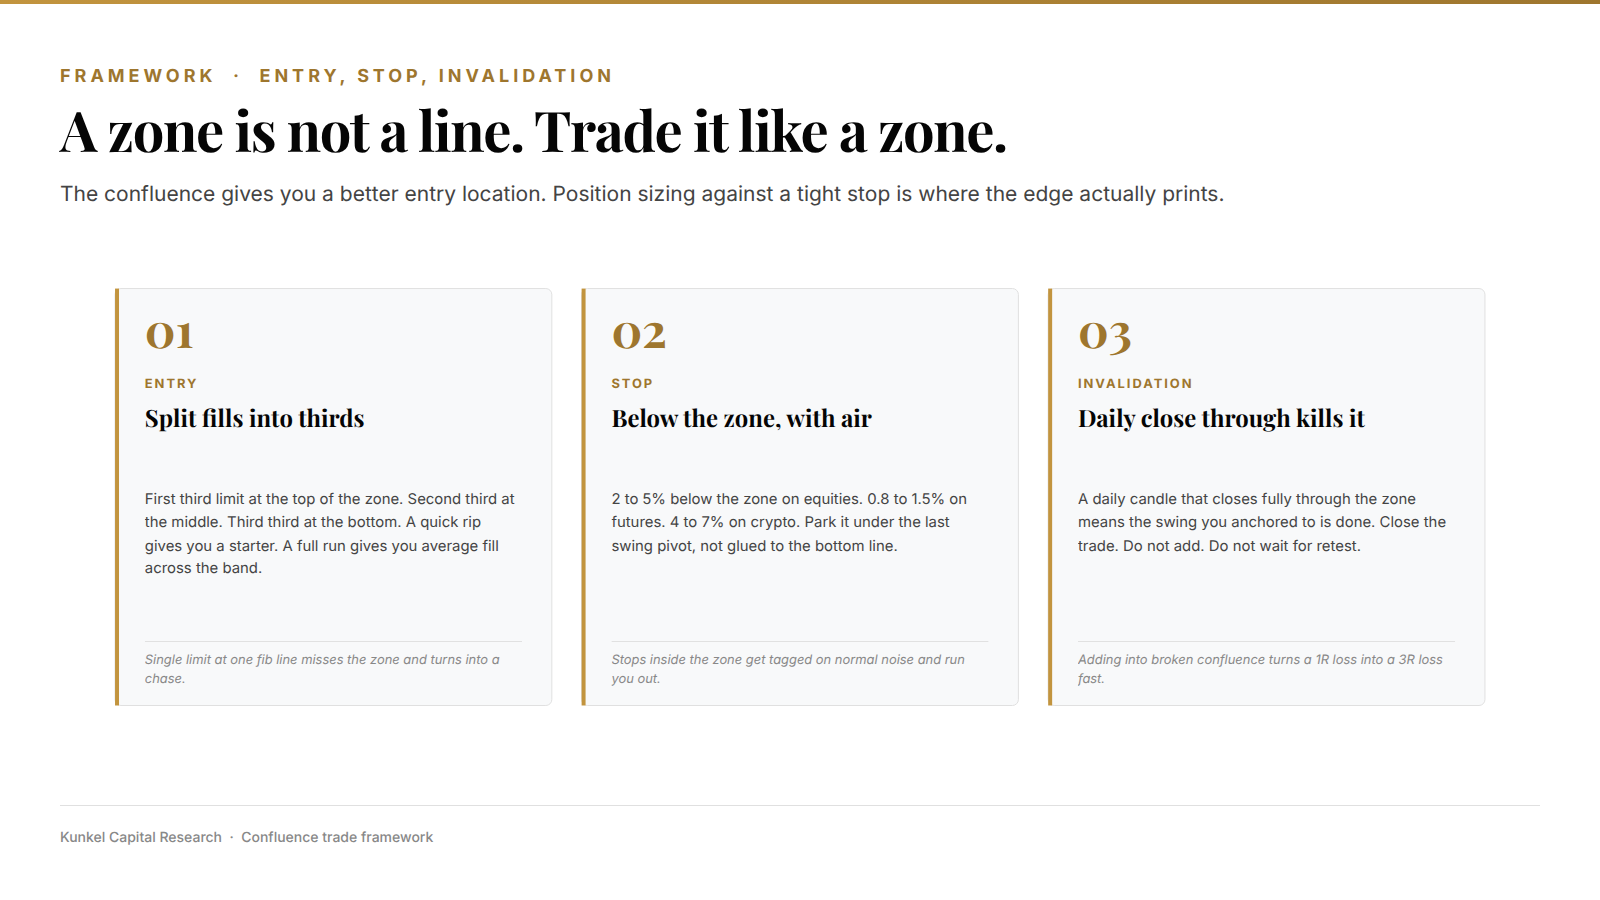
Invalidation. If price closes a daily candle fully through the zone, the trade is wrong and the swing you anchored to is done. Close it. Don't add. Don't wait.
Position size is where most traders blow this up. The zone gives you a better-than-average entry location, which means your stop is tighter relative to the expected move, which means you can size bigger in dollar terms without changing your R. That's the real edge. Not a magic level. Just a location that lets your stop work harder.
Wait, I should be honest. I've been treating all three swings as if they contribute equally. They don't. The dominant swing (usually the weekly) carries more weight than the intraday. If only two of three confluences land in the zone and the weekly is one of them, the setup still works. If the weekly is missing from the cluster, skip the trade. My guess is that weekly-missing zones fail most of the time, but I don't have clean stats on it, so take that as a preference rather than a hard rule.
Where the framework breaks
Three failure modes. Knowing them is what keeps this from turning into a religion.
Trend breaks. If the swing you anchored to is already broken by the time you're drawing the fib, the levels are historical, not active. Check whether price has made a lower high in an uptrend, or a higher low in a downtrend, before trusting the retracement zone.
Macro tape turns. Fib confluence does not care about FOMC. If you're entering the zone an hour before a rate decision, the setup is hostage to news. My rule is simple: don't initiate a confluence trade inside 24 hours of an FOMC print or a major CPI release. Let the news print. Redraw the swings after.
The zone is too wide. If your three 61.8s span 4% of price, that's not a zone. That's three separate fib lines and you're pretending. A real zone is tight enough that your stop below it still gives you 2:1 or better.
One more thing. This isn't a setup that generates daily signals. On a single instrument, clean confluence maybe prints twice a month at best. Most of the time the market doesn't offer a zone worth trading. The trade you skip is also a trade.
How we use confluence inside Kunkel Capital Research
We don't publish every level we draw. What we publish is the zone that survives all three timescales plus our macro filter. When the daily, weekly, and intraday all agree on a Fibonacci confluence zone and macro isn't fighting the direction, that's a trade we'd take.
The same screening logic feeds the signals we send to members. Most mornings, no zones clear the bar. Some weeks, three do at once. The discipline is refusing to force a trade on a single line just because the chart is open.
If this is the kind of framework you want running against your watchlist every morning before the US open, the research service is built for exactly that. The analysis that writes this post is the same analysis that flags the setups.