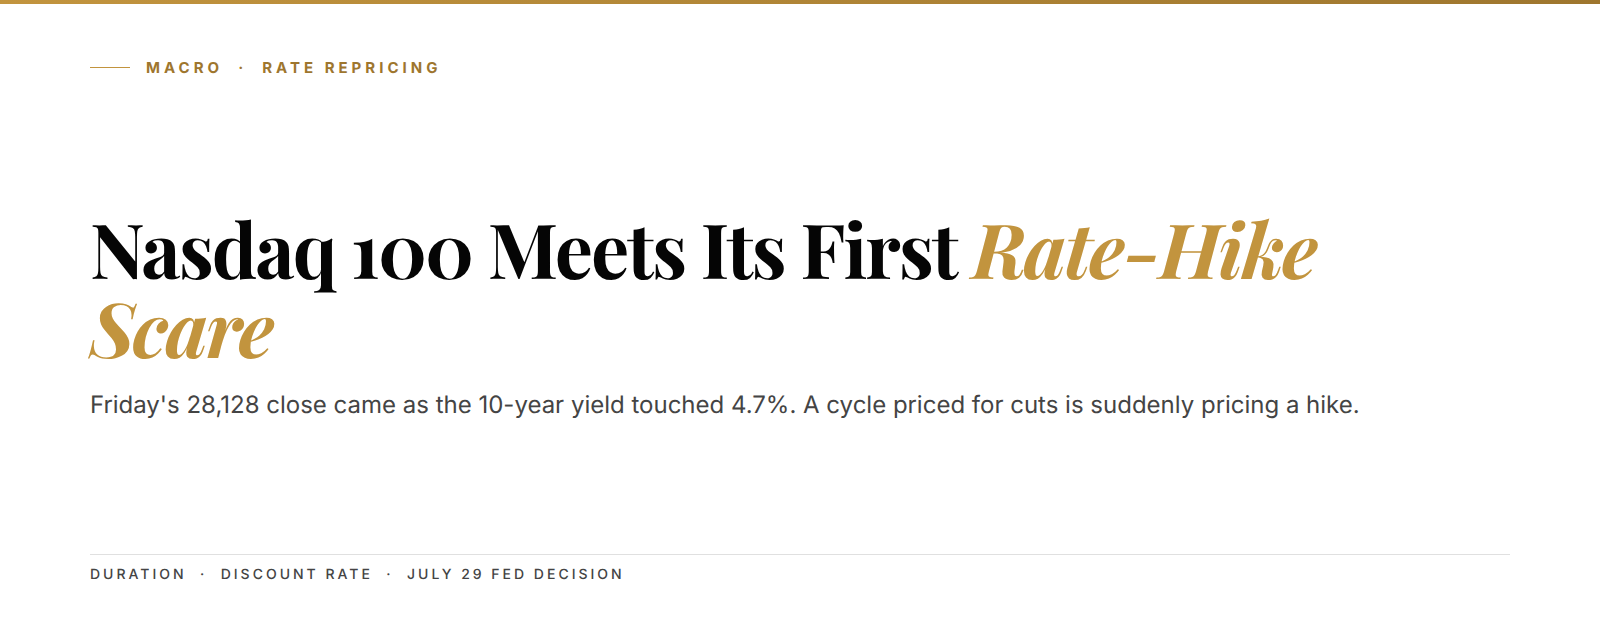
The Nasdaq 100 closed at 28,128.34 on Friday, down 1.15% and locking in its first back-to-back weekly loss since late March. For two years Wall Street priced the next Fed move as a cut. That story just cracked. Inflation printed 4.2% in June, the hottest reading in three years, and the 10-year Treasury yield touched 4.7% on Thursday, its highest since January 15, 2025. So the tape is no longer arguing about how fast the Fed eases. It's arguing about whether the Fed hikes.
The setup in 3 lines:
- Nasdaq 100 fell to 28,128.34 on Friday, July 24, and semiconductors led the drop with Intel off nearly 8%.
- The 10-year yield at 4.7% is the mechanism, because a higher discount rate marks down the highest-multiple growth names first.
- Watch the July 29 Fed decision and the 28,000 round number, since rallies keep getting sold while yields sit at cycle highs.
Here is the number that reframed everything. As of 2026-07-27, CME FedWatch shows traders assigning above 81% odds to a rate hike by September, with roughly a one-in-three chance the move comes this Wednesday. A hike. Not a hold that leads to a cut. The last time the market seriously priced tighter policy into a tech-heavy index, the Nasdaq 100 lost a fifth of its value in ten weeks. That memory is why Friday felt heavier than a 1.15% print should.
Friday's 28,128 close was a rate story, not an AI story
The easy read blames chips, and the tape gives you cover for it. A gauge of semiconductor firms sank 4.3% on Friday. Intel dropped nearly 8% even after second-quarter results beat, Broadcom slid 2.7%, and AMD fell 3.3%. If you stopped there, you'd call it an AI-capex wobble and move on.
But look at what led on the other side. Apple jumped 3.5% and carried the Dow to a flat finish while the Nasdaq 100 bled. That split is the giveaway, because money didn't leave equities at all. It rotated out of the longest-duration, highest-multiple corner of the market and into names that throw off cash today. That is a rate trade wearing a semiconductor costume.

Duration is the word that matters here. A growth stock is a promise of profits far out in the future, and those future profits are discounted back to today using the long bond. When the 10-year yield climbs, the math shrinks tomorrow's earnings in today's price, and it shrinks them most for the companies whose payoff sits furthest away. The AI leaders are exactly those companies.
28,128.34. The Friday close that turned an AI narrative into a duration problem the whole index has to solve.
So Friday wasn't a verdict on whether AI demand is real. It was a verdict on the rate used to value it. Get that distinction wrong and you fight the wrong war for the next month.
The 10-year at 4.7% is the only number that moved this week
Yields did the work, and everything else followed. On Thursday the 10-year Treasury yield pushed above 4.7% for the first time since January 15, 2025, then eased one basis point to 4.693% on Friday as oil retreated. BlackRock, the largest manager of US Treasuries among asset managers, watched the long end of its bond book mark lower through Thursday afternoon as that bid thinned out. When the world's biggest bond holder is absorbing a repricing, the equity desk two floors up feels it by the close.
The push came from a place equities can't ignore. Iran has kept the Strait of Hormuz effectively shut since late February, and the energy squeeze has kept a floor under inflation all year, and June's 4.2% CPI is the receipt. Higher oil feeds headline inflation, higher inflation feeds rate-hike odds, and higher rate-hike odds feed the long bond. That chain ran in full this week.
Put simply: the bond market stopped believing the Fed is done, and stocks that live and die on the discount rate got the bill first. The 10-year isn't background noise for the Nasdaq 100, and right now it's the steering wheel.
One honest uncertainty is worth naming before we go further. Friday's one-basis-point retreat came because oil dipped, and if Hormuz reopens the whole inflation impulse softens fast. We don't know the timeline on that, and nobody credibly does. What we do know is where the pressure sits until it changes.
September hike odds above 81% flipped the entire equity setup
The regime, not the headline, is the story. For most of this cycle the debate was cut timing. Now the debate is hike risk, and that inversion changes how every high-multiple name gets valued. A market that expects easing pays up for future growth. A market that fears tightening does the opposite, and it does it quickly.
Consider what the repricing has already done. Here is the shift in five numbers.
- Inflation ran to 4.2% in June, a three-year high, versus the sub-3% path priced at the start of the year.
- The 10-year yield hit 4.7%, the highest since January 15, 2025.
- September hike odds sit above 81% as of 2026-07-27, up from near zero in spring.
- The Nasdaq 100 closed at 28,128.34, its first back-to-back weekly loss since late March.
- Semiconductors fell 4.3% on Friday while Apple rose 3.5%, the sharpest rotation of the week.
Read those together and the picture resolves. This is a valuation reset driven by the cost of money, not an earnings collapse.

Corporate profits, by the way, are holding up. That's precisely why the index is only down 1.15% and not 10%. The fundamentals aren't broken, but the discount rate is.
History rhymes here, and it's worth the reminder. The last real tightening scare hit tech in early 2022, when this same duration math cut the Nasdaq 100 by roughly a third before it found footing. This isn't that yet, and the differences matter. Profits are stronger now, positioning is lighter, and the move so far is measured in single-digit percents rather than double. The reflex, though, is identical to the one that ran in 2022. When the cost of money rises, the market pays less for growth it has to wait for, and it re-rates the leaders first.
The Nasdaq 100 is one of the assets on the Kunkel Capital rotation, and members get the full structure map with entry, exit and invalidation refreshed on a fixed cycle. That map is the difference between watching the 28,000 line and knowing what you'd do at it.
Semiconductors led down because duration gets marked first
The order of the selloff tells you the mechanism. When rates spike, the market doesn't sell everything at once. It sells the longest-duration assets first, then works down the curve toward cash-rich, near-term earners. Semiconductors sit at the far end of that curve, so they get run before anything else.
Think of it like a mortgage. A 30-year loan reprices far more violently to a rate change than a 5-year loan, because more of its value sits in distant payments. An AI chip name priced on 2030 earnings is the 30-year mortgage of the equity market. Apple, spinning off cash and buybacks now, is closer to the 5-year. That's why one fell 3.3% while the other rose 3.5% on the same afternoon.
4.3% down in chips, 3.5% up in Apple. Same tape, same day. The spread is the duration trade in one line.
This is also why the leadership matters more than the level. The Nasdaq 100 is roughly half semiconductors and mega-cap software by weight, so when duration gets marked, the index carries the heaviest load among the majors. The S&P 500 finished Friday near flat at 7,411.98 for exactly this reason. Same macro, but lighter duration and a smaller wound.
Where the Nasdaq 100 structure stands into the July 29 Fed decision
Structure beats prediction into a binary event, so start with what the chart actually shows. The Nasdaq 100 spent the spring grinding to new highs, and Friday's close at 28,128.34 sits above the 28,000 round number that capped the market on the way up. That level flipped from ceiling to floor earlier this year, and it's now the line the tape is leaning on. Round numbers that already held once tend to get retested, and this is the retest.
Our read is that the index is working through a corrective phase inside a larger uptrend, not the start of a trend reversal. The evidence is in the internals: profits are firm, the selling is concentrated in the rate-sensitive names, and breadth held up enough that most S&P 500 members actually rose Friday. That is what a valuation reset looks like, not a growth scare. The rate path, not the earnings path, decides how deep this correction runs.
The character of the selling backs the read, at least so far. Friday's decline was orderly rather than a panic, and breadth held up with most S&P 500 members closing green even as the index barely moved. Orderly selloffs inside uptrends tend to be corrections, while disorderly ones tend to be tops. So far this looks like the former. That can change fast if Wednesday goes the wrong way, which is the whole reason the level matters more than the forecast.
So here is where we are wrong. This thesis breaks if the 10-year keeps climbing toward 5% and the Nasdaq 100 loses the 28,000 area on a weekly close, with the Fed confirming a hiking bias on Wednesday. That combination would turn a duration correction into a genuine regime change, and the structural read would flip with it. We tell you the behavior that invalidates the call. The exact level where we'd act on it is what the full research maps.
For now the setup is coiled, not broken. The July 29 Fed decision at 2 p.m. ET, and Warsh's press conference thirty minutes later, will set the tone for August. A Fed that signals patience lets duration heal and the 28,000 floor hold. A Fed that leans hawkish presses the same wound that opened Friday. You don't have to guess the outcome to prepare for both.
Frequently asked questions
Why did the Nasdaq 100 fall on July 24, 2026? The Nasdaq 100 closed at 28,128.34, down 1.15%, driven by a 4.3% drop in semiconductors as the 10-year Treasury yield hit 4.7%. Rising yields lower the value of high-multiple growth stocks, so the rate-sensitive tech leaders led the decline.
Is the Fed going to hike rates in 2026? As of 2026-07-27, CME FedWatch shows above 81% odds of a hike by September and roughly a one-in-three chance at the July 29 meeting. June inflation at 4.2%, a three-year high, is the reason the market repriced from cuts to hikes.
What level matters most for the Nasdaq 100 now? The 28,000 round number is the line to watch. It capped the index on the way up, flipped to support, and Friday's close sits just above it. A weekly close back below it while yields climb would mark a shift from correction to something deeper.
Is this a rate problem or an AI problem for tech stocks? It's a rate problem. Corporate profits held up and Apple rose 3.5% the same day chips fell, which points to a valuation reset from higher discount rates, not an earnings collapse in AI demand.
Know your entry, your exit, and where you are wrong on the Nasdaq 100
The first rate-hike scare of a cycle priced for cuts is the surface signal. The Nasdaq 100 is on the Kunkel Capital watchlist. The full research maps the current wave count to a defined entry zone, an exit target and the exact invalidation level, refreshed on a fixed rotation, with alerts when levels hit. €19.99 first month, then €34.99. Cancel anytime.
Last updated: 2026-07-27