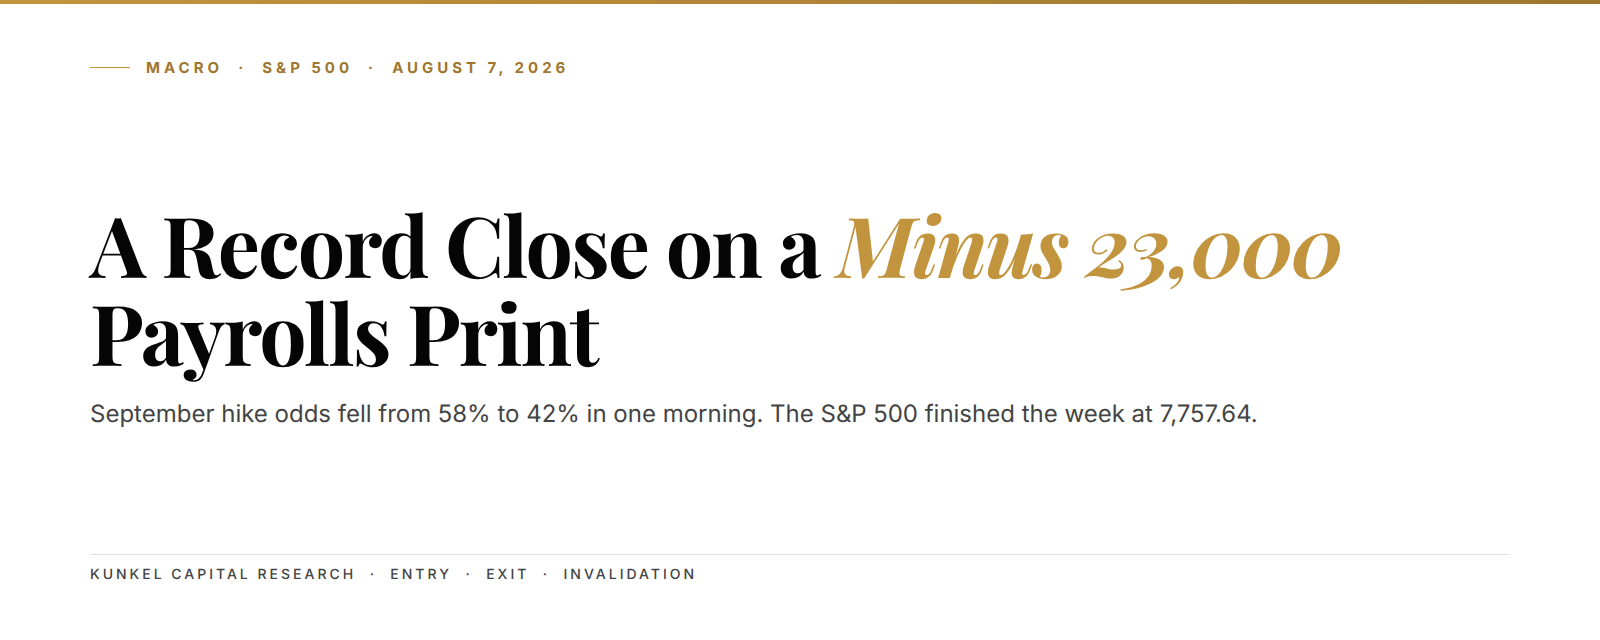
The S&P 500 closed at a record 7,757.64 on Friday, August 7, 2026, hours after the government reported the US economy lost 23,000 jobs in July. Consensus expected roughly 80,000 new jobs and got a contraction instead, yet the index rallied to cap its strongest week since April. A hike-off rally is a stock rally powered by falling rate-hike odds rather than by improving growth, and that is exactly what Friday was. The difference decides how durable the record is.
---
The setup in 3 lines:
- July payrolls printed minus 23,000 against expectations near plus 80,000, and September hike odds fell from 58% to 42%.
- Stocks, gold and Treasuries rallied together on the print, which marks this as a discount-rate rally, not a growth rally.
- The record close keeps the structure pointed up, but the advance now leans on a single engine: a Fed boxed out of hiking.
At 8:30 a.m. Eastern on Friday, the Bureau of Labor Statistics released the July Employment Situation report: payrolls down 23,000, unemployment down a tick to 4.1%. Within minutes, futures traders cut the odds of a September rate hike from 58% to 42% on CME FedWatch. And by the closing bell, the S&P 500 had printed its second record of the week.
September hike odds sat near 58% on Thursday night, and one print cut them to 42%
Rewind to Thursday night to see why the print hit so hard. The federal funds rate sits at 3.50-3.75% after the July meeting, where the committee held policy while three members dissented in favor of an immediate hike. We wrote about that hawkish split when Bitcoin's $60,000 floor survived the July hold, and nothing since had softened it. So markets spent early August treating a September 16 hike as more likely than not.
Inflation is the reason the hike debate existed at all. June CPI ran at 3.5% year over year, well above the 2% goal. And the Strait of Hormuz is still a negotiation rather than a signed deal, which keeps energy prices doing the pushing and the inflation path uncertain. A hike into that backdrop would have raised the discount rate on every earnings stream in the index at once. That threat sat over the whole tape like a ceiling, and you could see it in how hesitant July's closes were.
Then the jobs number landed. A central bank doesn't raise rates into an economy shedding jobs, whatever the inflation backdrop, and traders repriced that reality in minutes rather than weeks. The 10-year Treasury yield fell seven basis points to roughly 4.6%, and the Nasdaq closed up 1.30% at 26,691.

Minus 23,000 against plus 80,000. A 103,000-job miss repriced the entire September meeting before lunch.
Stocks, gold and bonds rallied on the same print, and that mix has one engine
Friday's cross-asset tape is the tell. The S&P 500 added 0.62% to finish at 7,757.64. Gold jumped 2.31% to $4,339, its strongest level since mid-June, and we had just traced that bid in gold's rally into the Hormuz deal.
The rest of the complex confirmed the pattern. Silver ran to a six-week high on the same print, a move we covered in silver's post-payrolls breakout. Bitcoin bounced off the shelf it had defended three times, a read we closed out in our payrolls-bounce post-mortem. And Treasury yields fell across the curve at the same time, which is the piece that gives the game away. Bonds don't rally on good news for the economy. They rally when the expected path of rates shifts lower, and on Friday that shift was the only new information in the world.
When you see equities, gold and bonds all catch a bid on the same data point, the common factor isn't growth. It is the discount rate, the rate markets use to value future cash flows: when it falls, every long-duration asset gets marked up at once. A growth rally looks different. It sells bonds, ignores gold, and leans on cyclicals instead.
Translation: the market didn't celebrate the economy on Friday. It celebrated the Fed being boxed out of tightening.

July's tape already showed an index running on rotation, not breadth
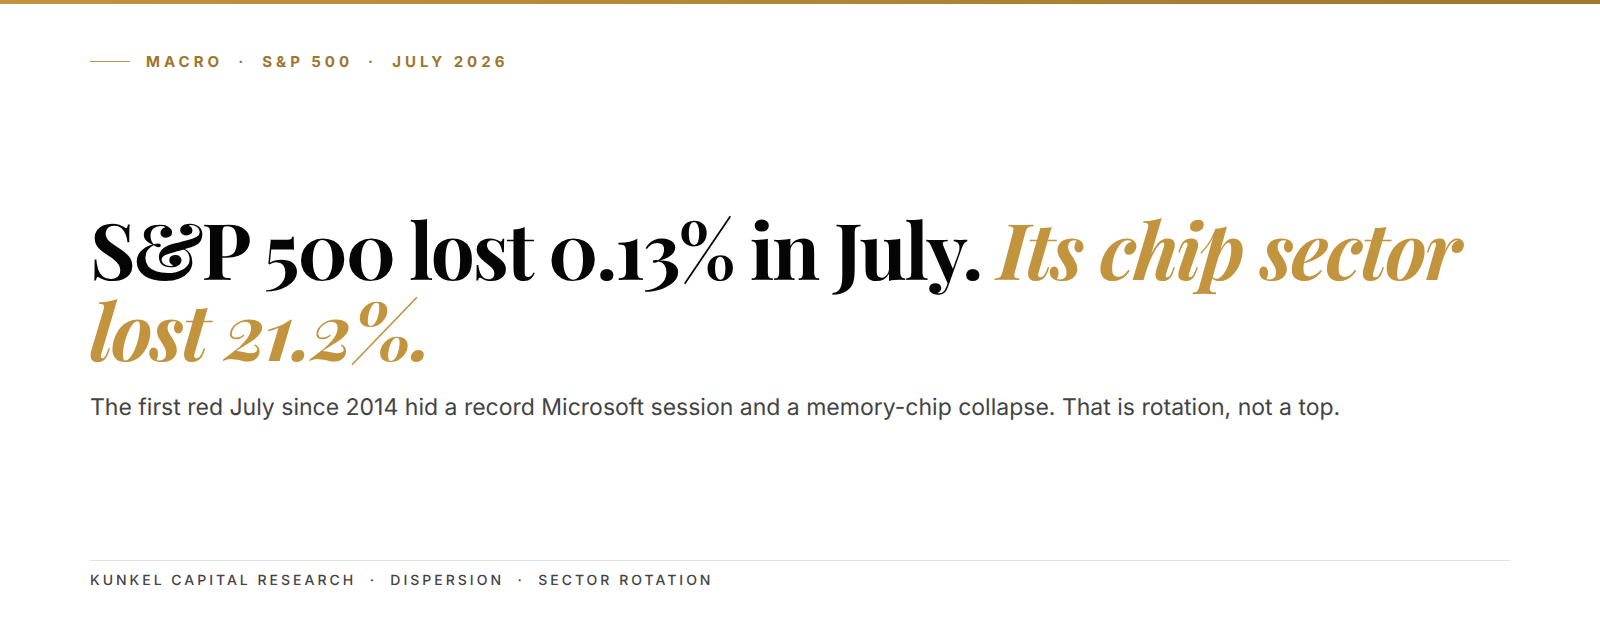
Rewind four weeks and Friday's record looks stranger. The S&P 500 lost 0.13% in July while its semiconductor sector lost 21.2%, a split we mapped in the July breadth post. Earnings week added to the stress, because Microsoft and Amazon both gapped double digits on their prints, moves we walked through in the Microsoft gap read and the Amazon backlog read. And the index barely noticed, because money rotated instead of leaving.
That rotation cuts both ways for the record. In its favor, an index at all-time highs has no overhead supply (no trapped buyers from higher prices waiting to sell into strength), so the path up meets less friction. Against it, the advance is being carried by fewer legs, and Friday added a rate engine without repairing the breadth one.
If you only watched the index level this summer, you missed that fight entirely. The record is real, but so far it is a record built on rotation plus rate relief, and both of those are conditions rather than trends. That distinction matters for everything that follows.
A negative payrolls month with 3.5% inflation is not an all-clear
Inside the report, the two surveys told different stories. The establishment survey, the poll of businesses that produces the payrolls number, showed 23,000 jobs lost. But the household survey, the separate poll of families that produces the unemployment rate, showed joblessness falling to 4.1%. That mix usually means people left the labor force rather than found work, which is the softer kind of soft.
There is a reason that distinction matters for the index. A shrinking labor force flatters the unemployment rate while it quietly erodes the spending base that sits underneath earnings. In other words, the household survey made Friday's headline look calmer than the payrolls tape underneath it. The market chose to trade the calm version.
Our first instinct on Friday was to file the print as an outlier, one bad month in an otherwise stable series. Wait, actually: the honest answer is that nobody knows yet. Payroll prints get revised twice in the months that follow, and single negative months have been false alarms before. So that uncertainty is part of the read, not a footnote to it.
The numbers that define the post-payrolls regime:
- Payrolls: minus 23,000 in July against a consensus near plus 80,000.
- Unemployment: 4.1%, down from 4.2%, on a shrinking labor force.
- Inflation: 3.5% CPI year over year as of the June print.
- Policy rate: 3.50-3.75%, held in July with three dissents in favor of a hike.
- September hike odds: 42% after Friday, down from 58% the night before.
- S&P 500: a record 7,757.64 close, up 3.58% on the week.
Put simply, the Fed is boxed in from both sides. It can't hike into job losses, and it can't ease into 3.5% inflation while the Hormuz reopening is still being negotiated. Stocks are enjoying that box for now. The mistake would be confusing the box with an all-clear, because a box is a condition, and conditions expire.
The structural read: the record extends the trend, and the engine has one leg
Structurally, Friday settled an argument. The push off the April base survived July's rotation stress and resolved into new highs, which keeps the larger advance intact by definition. The week began with the index under 7,500 and ended at 7,757.64, so this leg now has a fresh origin that any free chart shows.
That origin is the reference that matters from here, and it needs no model to find. The old record from earlier in the week, the round 7,500 area underneath, and the April base below that: those are the shelves the market itself built. A healthy extension holds above the first shelf on any pullback and keeps the pullbacks brief. A tired one slices back through it within days, and that is the behavior we watch for next week.
3.58% in five sessions. The strongest S&P 500 week since April began with the index under 7,500.
Think of the rally as a twin-engine plane flying on one engine. It flies, and it can fly a long way. But every foot of altitude now depends on that single engine, and the engine here is a Fed that stays boxed out of hiking. The growth engine isn't just idle; July's payrolls say it may be running in reverse.
The calendar tests both engines almost immediately, and if you're positioned in the index, that calendar is your risk. The next CPI release is the first test, because a hot print re-arms the September hike bet that Friday just buried. The next payrolls report is the second, because another negative month turns "the Fed is boxed out" into "the economy is rolling over", and that is a different market entirely.
Here is where the thesis breaks: a weekly close back under the low-7,500s, the area where this breakout week began, while September hike odds rebuild above 50%. That combination would mean the rate engine quit with price back inside the old range, and we would treat Friday's record as a failed break rather than a trend extension. Until then, the burden of proof sits with the bears.
The S&P 500 is one of the assets on the Kunkel Capital rotation: members get the full structure map with entry, exit and invalidation refreshed on a fixed cycle.
As of August 10, 2026, the read stands: trend up, engine singular, and every scheduled data print now matters more than the one before it did.
FAQ: the record close and the negative payrolls print
Why did the S&P 500 rally on a bad jobs report?
Because the report removed the near-term rate-hike threat. Going into Friday, markets priced a September hike at 58%, and the negative payrolls print cut that to 42%. Falling rate expectations lift the value of future earnings, so the index rallied even though the economic news itself was poor.
Is a negative payrolls print bearish for the S&P 500?
Not immediately. The first soft prints in a cycle often support stocks, because they push the central bank toward easier policy while earnings are still intact. The risk builds if job losses continue, since falling employment eventually hits revenue, credit, and the earnings that valuations rest on.
What would prove the hike-off rally wrong?
A weekly close back inside the pre-breakout range while September hike odds rebuild above 50%. That pairing would mean the discount-rate support failed and price rejected the new highs. We treat that combination as the invalidation condition for the current read.
What is a hike-off rally?
A hike-off rally is a rise in stock prices driven by falling odds of a central-bank rate hike rather than by stronger growth. Stocks, gold and bonds tend to rise together in one, which is how you can tell it apart from a growth-driven rally that sells bonds and ignores gold.
Know your entry, your exit, and where you are wrong on the S&P 500
The hike-off repricing is the surface signal. The S&P 500 is on the Kunkel Capital watchlist: the full research maps the current wave count to a defined entry zone, an exit target and the exact invalidation level. Levels refresh on a fixed rotation, with alerts when they hit. €19.99 first month, then €34.99. Cancel anytime.
Sources: US Bureau of Labor Statistics, Employment Situation Summary for July 2026, released August 7, 2026; CME FedWatch; Reuters market coverage of the August 7 session. This is market commentary, not investment advice.
Last updated: 2026-08-10