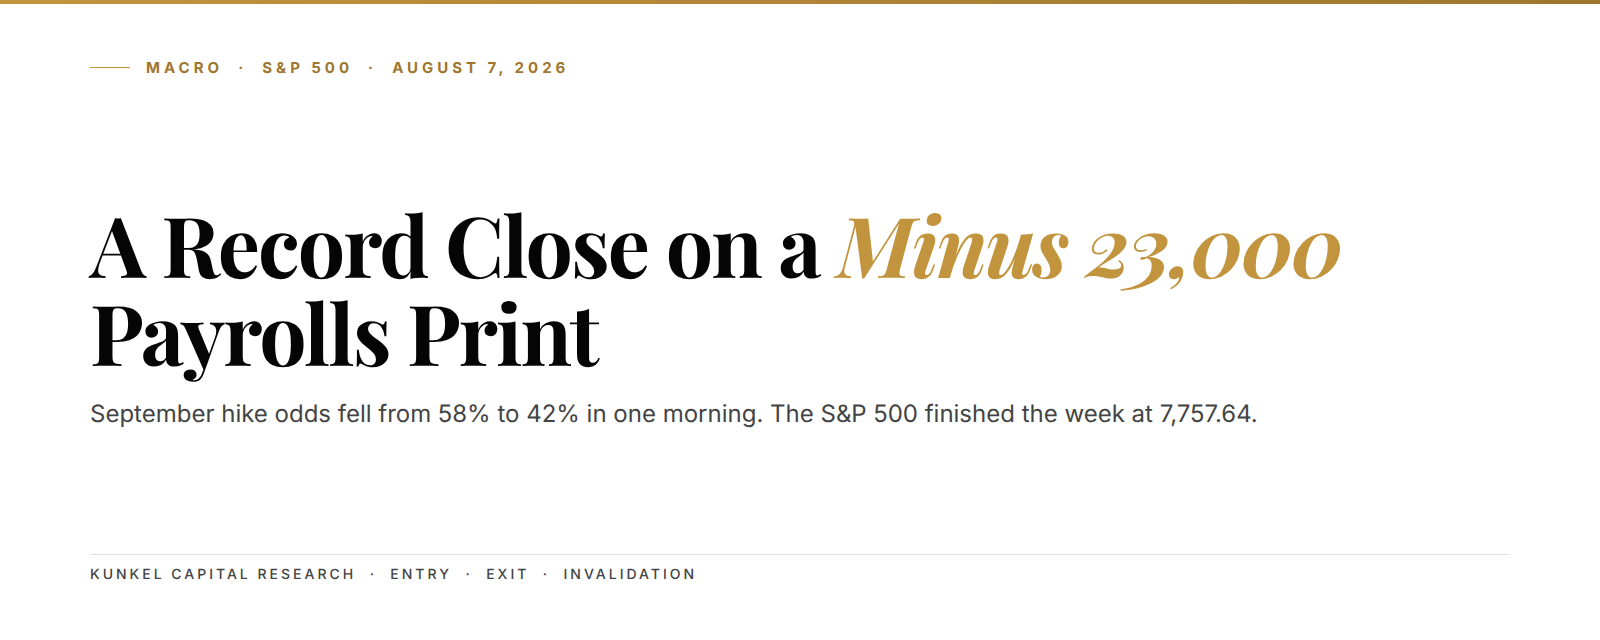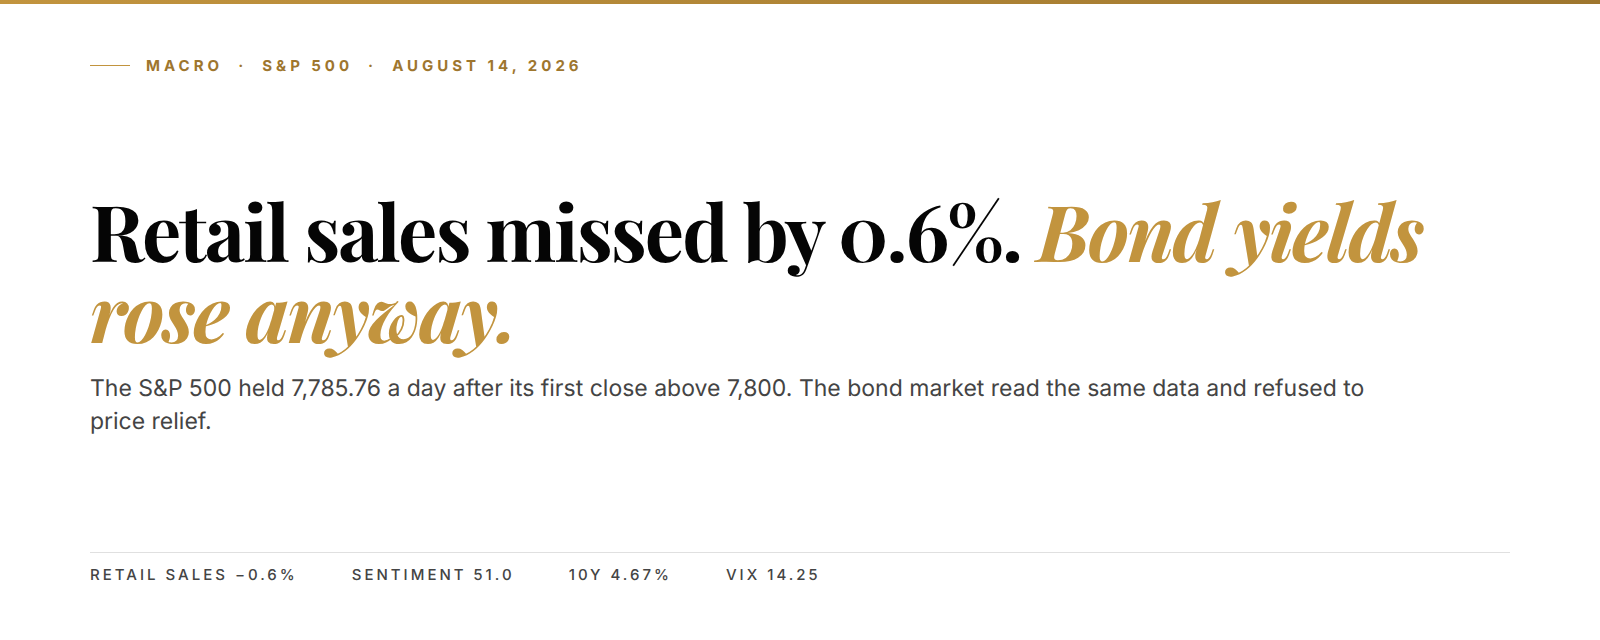
The S&P 500 closed at 7,785.76 on Friday, August 14, 2026, one day after clearing 7,800 for the first time in its history. That same morning, July retail sales fell 0.6%, the biggest monthly drop in more than a year. Consensus says a weak consumer means falling bond yields and a Federal Reserve with room to ease. Instead the 10-year Treasury yield rose five basis points to 4.67%. When a consumer slowdown fails to pull yields down, the bond market is pricing stagflation rather than relief, and that is the most important thing that happened last week.
---
The setup in 3 lines:
- July retail sales fell 0.6% against expectations of a 0.1% gain, and sentiment dropped to 51.0 from 55.2 in July.
- Yields rose anyway, because the same survey put one-year inflation expectations at 4.3%, which keeps the Fed pinned.
- The record close still stands, but the advance now rests on a rate-cut assumption the bond market refuses to fund.
At 8:30 a.m. Eastern on Friday, the Census Bureau published its advance retail report: $763.6 billion of July sales, down 0.6% on the month. Ninety minutes later the University of Michigan survey team released its preliminary August sentiment reading at 51.0, roughly eight percent under July and three and a half points below consensus. Two soft prints inside two hours. By the closing bell the index had lost all of 0.2%, and the VIX had slipped to 14.25, its lowest level since December 29.
Retail sales fell 0.6% in July, the biggest monthly drop in more than a year
Start with the number that moved first. July retail and food services sales came in at $763.6 billion, down 0.6% from June against a consensus looking for a small gain. That is still up 5.0% from July 2025. So this is a deceleration, not a collapse. But the direction caught a market that had spent three weeks pricing the opposite.
The category detail is where it gets interesting. Non-store retail fell 2.2% on the month, autos and parts dropped 1.8%, and gasoline stations slipped 0.9% as pump prices eased. Bars and restaurants went the other way, up 0.5% on the month. So the American consumer did not stop spending. He stopped buying things and kept buying nights out. That is a mix shift, and mix shifts are slower than they look.
Wait. Before anyone builds a thesis on one print, a real chunk of that drop is calendar noise. Amazon ran Prime Day in June this year rather than July, which pulled online sales forward and left the July comparison looking worse than the trend. Strip that out and you get a soft month, not a broken one. We would not touch the S&P 500 structure on this data alone, and neither should you.
So what makes Friday matter is the second print. And the way bonds reacted to both of them.
Sentiment at 51.0 arrived with 4.3% inflation expectations, and that pairing is the problem
The University of Michigan reading is the one that should worry people. Headline sentiment landed at 51.0, ending two straight months of improvement. We flagged that improving run in July, when a sentiment rebound was still feeding the inflation bets, and Friday erased it in a single print. Current conditions fell 5.5% to 51.8, and the expectations index dropped 8.7% to 50.6. So the deterioration ran through both halves of the survey. Expected business conditions sank 11% for the short run and 17% for the long run.
Then comes the line that changes everything. In the same survey, one-year inflation expectations rose to 4.3% from 4.2%, and the five-to-ten-year measure sat at 3.3%. Households are not reporting a demand problem here. They are reporting a cost problem, and the war with Iran keeps fuel, energy and food doing the pushing. Only eight percent expect their income to outpace inflation next year. That is the lowest kind of confidence a survey can capture.
Translation: people feel poorer because prices are still climbing, not because they lost their jobs. That distinction decides what the Fed can do about it.
51.0 sentiment with 4.3% inflation expectations. That combination is not a rate cut. It is a central bank with its hands tied.
A cut into rising inflation expectations risks unanchoring them, which is the one outcome every central banker is trained to avoid. So the weak consumer no longer buys the market a rate cut, and nothing steps in to replace it.
The 10-year rose five basis points on data that should have rallied bonds
Here is the reveal, and it took about four seconds of tape to deliver. On a day with a retail sales miss and a sentiment collapse, the 10-year Treasury yield rose five basis points to 4.67%. The two-year, the maturity that tracks Fed policy most directly, added two basis points to 4.167%. Both should have fallen on that data, and neither of them did.
Picture a landlord deciding whether to cut the rent because his tenant just lost hours at work. Normally he would, at least a little. But his own property tax bill went up this year, and it went up more than he expected. So the tenant's problem never becomes a rent cut. That is the bond market on Friday, and the property tax is the 4.3% print.
This is the part of the week almost nobody wrote about, because the headline indexes barely moved and a quiet tape reads as a boring one. It isn't. A bond market that refuses to rally on weak consumer data is telling you the disinflation trade is finished for now. We made the same argument when real yields stopped predicting gold, and the mechanism here is the same one: the growth signal and the inflation signal have separated, so the old reflex trades stop working.
For equity holders, that removes the cushion. If the consumer keeps softening while yields stay put, earnings estimates get cut without the discount rate falling to offset them. Both sides of the valuation go the wrong way at once. That is the squeeze the S&P 500 has not priced yet.

VIX at 14.25 prices a market that still believes in a Fed put
Volatility tells you what the tape assumes rather than what it says. The VIX closed Friday at 14.25, its lowest level since December 29 and a fresh 2026 low. Options priced there imply a market expecting daily moves under one percent, day after day, for the next month. That is a calm assumption to hold. And the consumer data just cracked underneath it.
The Fed backdrop explains why the calm feels justified from the inside. The federal funds rate sits at 3.50-3.75% after the July 29 meeting, the fifth straight hold under Chair Kevin Warsh, and the hawkish June projections still stand with a median 2026 dot at 3.8%. Friday's data trimmed the odds of a September hike to roughly 32% from 35%. So the market spent the day removing a threat, not adding a stimulus. That same mechanic drove the record close after July's negative payrolls print took the hike off the table.
That is thinner support than it looks. Traders have priced out the punishment while pricing in none of the reward. And a VIX at 14 assumes that gap stays comfortable for a month. We walked through the same setup from the other side when the Nasdaq 100 met its rate-hike scare, and the resolution there came fast once positioning got one-sided.
The Russell 2000's fresh record is the counter-signal we cannot dismiss
Now the part that argues against us. On the very day the consumer print cracked, the Russell 2000 notched a record of its own. Small caps carry the most consumer exposure and the most floating-rate debt in the market. So they are exactly what should break first if the household story is turning. They made a new high instead.
There are two readings that fit, and both are live. The first is that small caps are front-running an easing cycle that arrives in 2027, looking through the soft patch the way equity markets usually do. The second is that this is the broadening final phase of a long advance, where the last laggards catch a bid just before the index peaks. Both look identical while they are happening.
We do not know which one this is. Anyone who tells you they do is selling something. What separates them is behavior rather than opinion. If small caps hold their breakout through the next soft data print, reading one wins. If they give it back inside two weeks while yields stay firm, reading two wins.
Five months of advance off the late-March low leaves this structure mature, not broken
Step back to the chart that matters. The S&P 500 bottomed in late March about nine percent under its then-record, during the worst of the Iran conflict headlines. April delivered roughly 10.5%, the strongest calendar month in over five years. Measured from the low, the index ran 12% in thirteen sessions. From there the advance slowed into a grind, and the grind carried the index through 7,800 on August 13 for a record close at 7,798.99.
That shape is textbook for a late-stage impulsive sequence in Elliott terms: a vertical leg out of a panic low, then a long, shallower advance on steadily declining volatility. The third leg does the damage and the fifth leg does the bragging. Volatility compressing to a yearly low in the fifth month of an advance fits that reading rather than contradicting it. So VIX 14.25 reads to us as a maturity signal, not an all-clear.

The S&P 500 is an always-on asset on the Kunkel Capital rotation: members get the full structure map with a defined entry zone, an exit target and the exact invalidation level, refreshed on a fixed cycle.
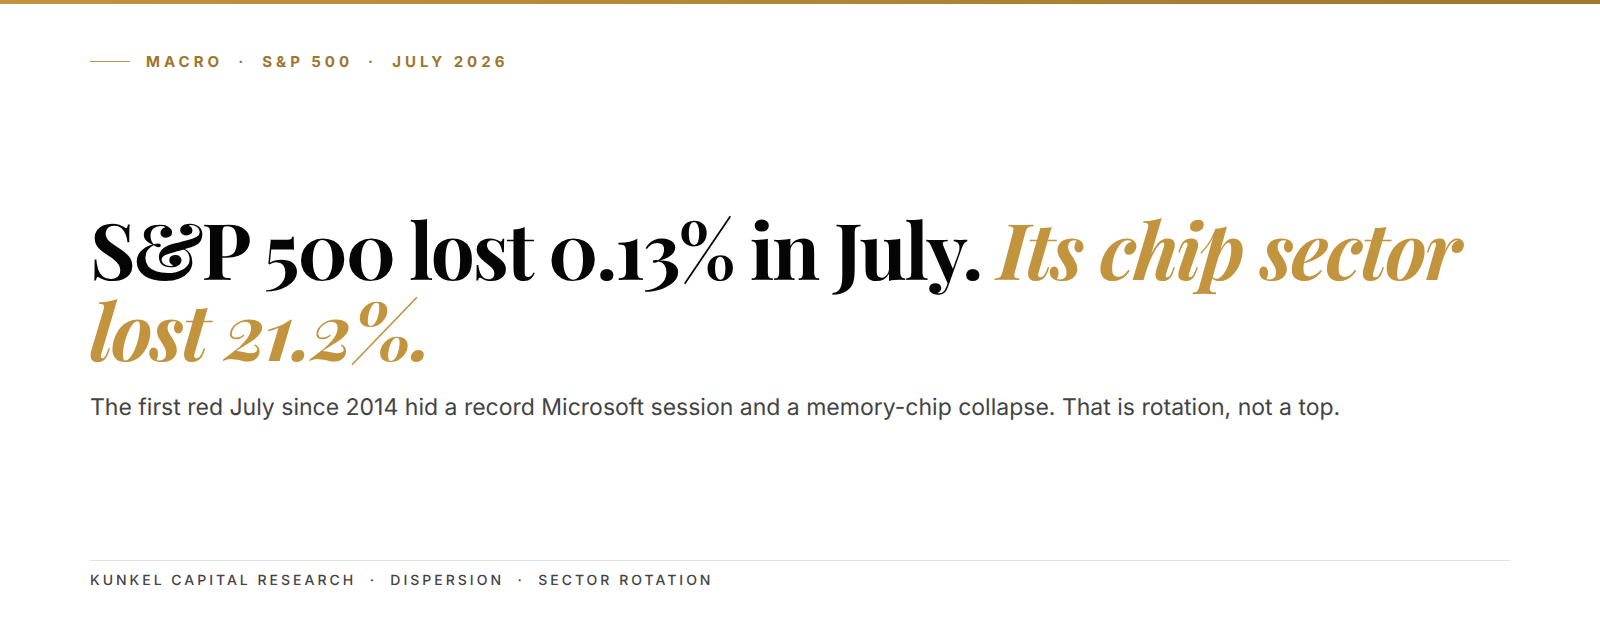
None of this makes the record fake. The trend is up, the breakout above 7,800 happened on real volume, and betting against a market at highs because the consumer feels bad is how people spent all of 2024 being wrong. We covered that lesson when the S&P 500 took a July loss on the semiconductor collapse and the index recovered anyway. Structure says up until it says otherwise.
Five numbers that define the week for the S&P 500
- 7,798.99 was the record close on August 13, the first time the index has ever settled above 7,800.
- -0.6% July retail sales, against a consensus near +0.1%, the biggest monthly drop in more than a year.
- 51.0 preliminary August consumer sentiment, down from 55.2 and roughly 3.5 points under estimates.
- 4.67% on the 10-year Treasury, five basis points higher on a day weak data should have pushed it lower.
- 14.25 on the VIX, the lowest close since December 29 and a new low for 2026.
Where this thesis breaks, and what would have to happen first
Our read is that the S&P 500 stays structurally intact. But its support has quietly changed hands. Until Friday, the bull case rested on a consumer that kept spending and a Fed that would eventually ease. The consumer print weakened the first pillar and the bond reaction removed the second, so what carries the index now is earnings concentration and the absence of a hike rather than any positive impulse. That is a market that can grind higher and still be one bad print from an air pocket, and a VIX at 14.25 is not paying you to hold it.
Where the thesis breaks is specific, and it is behavior, not a forecast. Say the 10-year starts falling hard on weak data again while inflation expectations roll back under four percent. Then the disinflation trade is alive and this read is simply wrong, and you would want to be long the index and long duration together. On the other side sits the confirmation. A weekly close back below the level the index broke out from, while yields hold above their July range and small caps hand back that record, tells you the fifth leg is finished. Either one of those settles it. Watching prices without watching yields will not.
For now the structure points up and the support underneath it is thinner than the headline suggests. That is the whole read. Cross-asset confirmation is worth tracking too, since gold's real-yield squeeze under Warsh and the two-year yield's pivot on the jobs print are both reading the same policy trap from different seats.
Frequently asked questions
Why did the S&P 500 barely fall on such weak consumer data?
Equity markets treat soft data as a Fed-easing signal by reflex, and the index had spent three weeks pricing out a September hike. The 0.2% decline reflects that reflex. But the bond market disagreed, which is the part worth watching.
Why did Treasury yields rise instead of fall on August 14?
The same University of Michigan survey that showed sentiment at 51.0 put one-year inflation expectations at 4.3%. Bonds priced the inflation half rather than the growth half. So the 10-year rose five basis points to 4.67%.
Is the July retail sales drop a recession signal?
Not by itself. A large share of the 0.6% decline came from non-store retail, distorted by Amazon moving Prime Day into June. Sales were still up 5.0% from a year earlier. The sentiment print is the more concerning of the two.
What happens at the September 16 Fed meeting?
Markets put roughly 32% odds on a hike after Friday's data, down from 35%. The funds rate has sat at 3.50-3.75% through five consecutive holds. And rising inflation expectations make a cut hard to justify.
Does a VIX at 14.25 mean the market is safe?
No. It means options are cheap relative to the risk sitting in the data. Low volatility at the end of a five-month advance has historically preceded an expansion in volatility, not more calm.
Know your entry, your exit, and where you are wrong on the S&P 500
A record close sitting on top of the worst retail sales print in a year is the surface signal. The S&P 500 is an always-on asset on the Kunkel Capital watchlist. The full research maps the current wave count to a defined entry zone, an exit target and the exact invalidation level, refreshed on a fixed rotation. Alerts fire the moment those levels hit. €19.99 first month, then €34.99. Cancel anytime.
Sources: US Census Bureau Advance Monthly Retail Trade Report (July 2026), University of Michigan Surveys of Consumers (August 2026 preliminary), Federal Reserve H.15 Selected Interest Rates, Bloomberg, Reuters.
Last updated: 2026-08-17