Nasdaq 100 closed up 0.21% at 29,544.15 on Friday, September 4, in the same session that pushed September rate-hike odds to 62%. Consensus holds that long-duration tech is the most rate-sensitive corner of the market. Six weeks ago it traded exactly that way. But on Friday the S&P 500 lost 0.38%, gold gave back 1.4%, and the index that should have been hurt worst closed green.
The setup in 3 lines:
- Nasdaq 100 rose 0.21% to 29,544.15 on Friday while the S&P 500 fell 0.38% and gold futures dropped 1.4%.
- August payrolls printed 162,000 against a 53,000 consensus, and rate futures moved September hike odds from roughly 55% to 62%.
- The reaction function changed, because nominal demand now outweighs the discount rate for this index, which is why hawkish news stopped working.
---
Here is the moment that set the trap. On August 28, in his 100th day as Fed Chair, Kevin Warsh took the podium at the Jackson Hole symposium. He said the summer's better inflation readings "do not tell me that underlying trends have meaningfully improved." That single line did the work. Odds of a September hike went from about a third to a coin flip within hours, and the whole rates complex spent the following week repricing around it.
So when the Bureau of Labor Statistics released the August employment report at 8:30 a.m. on Friday, the tape was already leaning hawkish. The print gave it every reason to lean harder. What happened next is the part worth sitting with.
Friday's 162,000 print tripled the 53,000 consensus and the index still closed green
The headline number was not close. Payrolls rose 162,000 in August against a consensus near 53,000, and unemployment held at 4.1%. That is the strongest month since March and the first gain in five.
Revisions made it worse for the doves. July flipped from minus 23,000 to plus 21,000, and June went from 20,000 to 31,000. So the two prints that had killed the hike trade over the summer were quietly taken back.
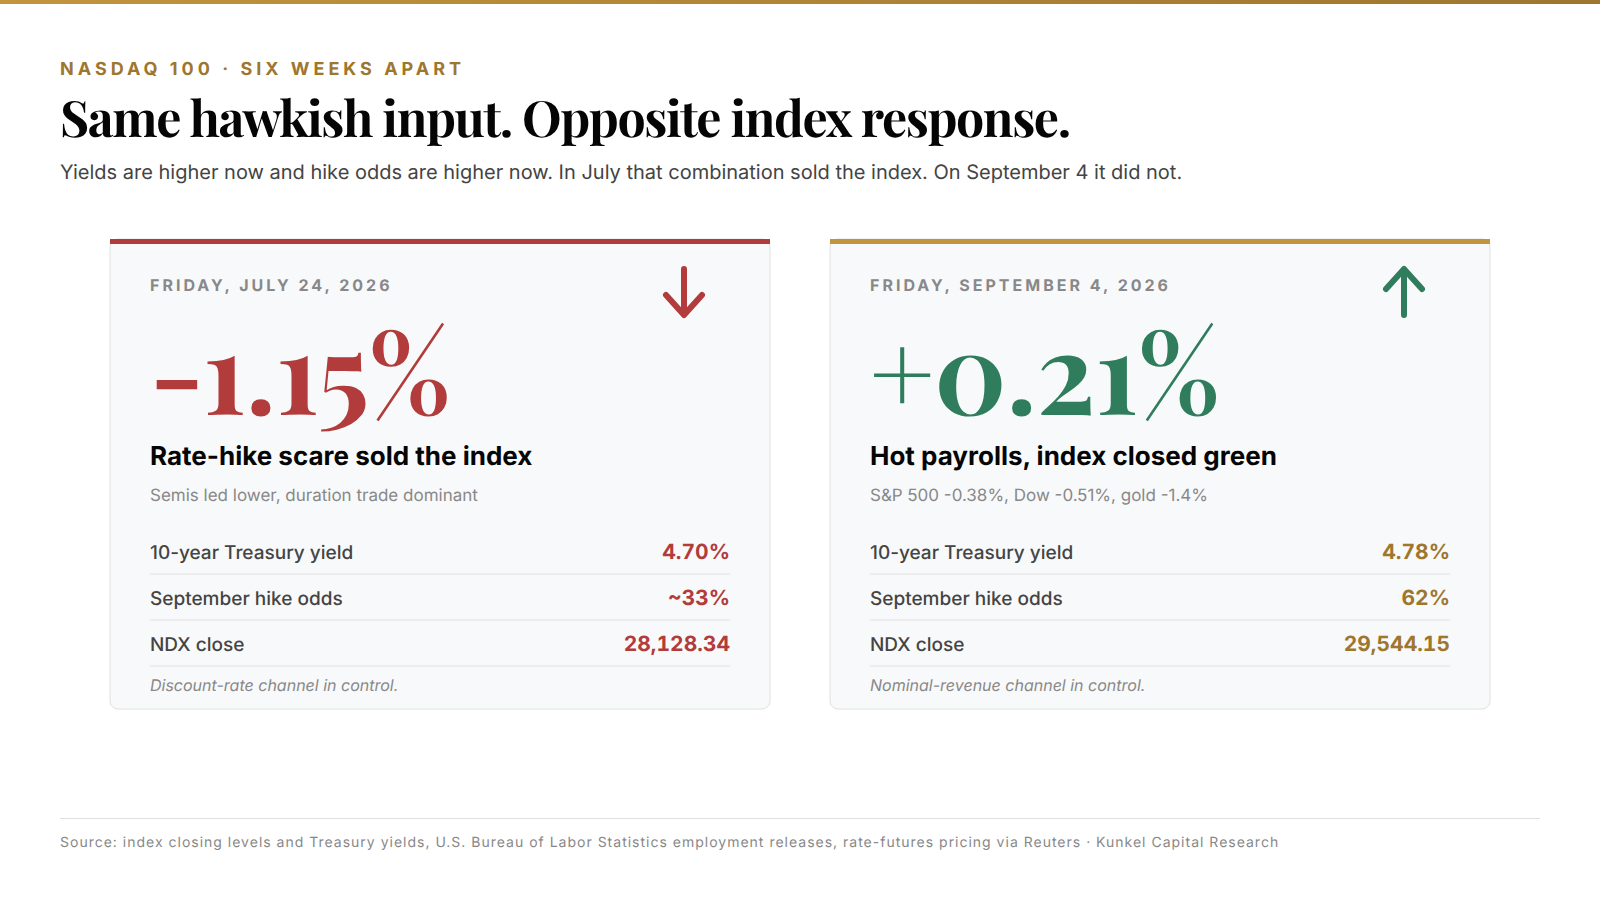
Markets then moved the way you would expect. The 10-year Treasury yield pushed to 4.78%, the Dow fell 0.51%, the S&P 500 lost 0.38%, and gold futures dropped about 1.4% to 4,429.80. Everything rate-sensitive got tagged.
Everything except the one thing that should have been hit hardest. The Nasdaq 100 added 61.83 points and closed at 29,544.15, which is a gain on the most hawkish macro session since Jackson Hole.
29,544.15 on a 62% hike day. The most rate-sensitive index on the board closed green on the print that made the hike a favorite.
Two categories delivered two-thirds of the gain, and neither one buys GPUs
Under the headline the print was narrow. Leisure and hospitality added 62,000 jobs, and food and drinking places alone accounted for 59,000 of those. Local government education added 42,000 after shedding 49,000 in July.
Add those up and you have most of the month. The rest came in thin, with construction at 22,000, manufacturing at 16,000 and healthcare at 13,000. Meanwhile the information sector, which is where much of this index's own workforce sits, lost another 23,000 jobs.
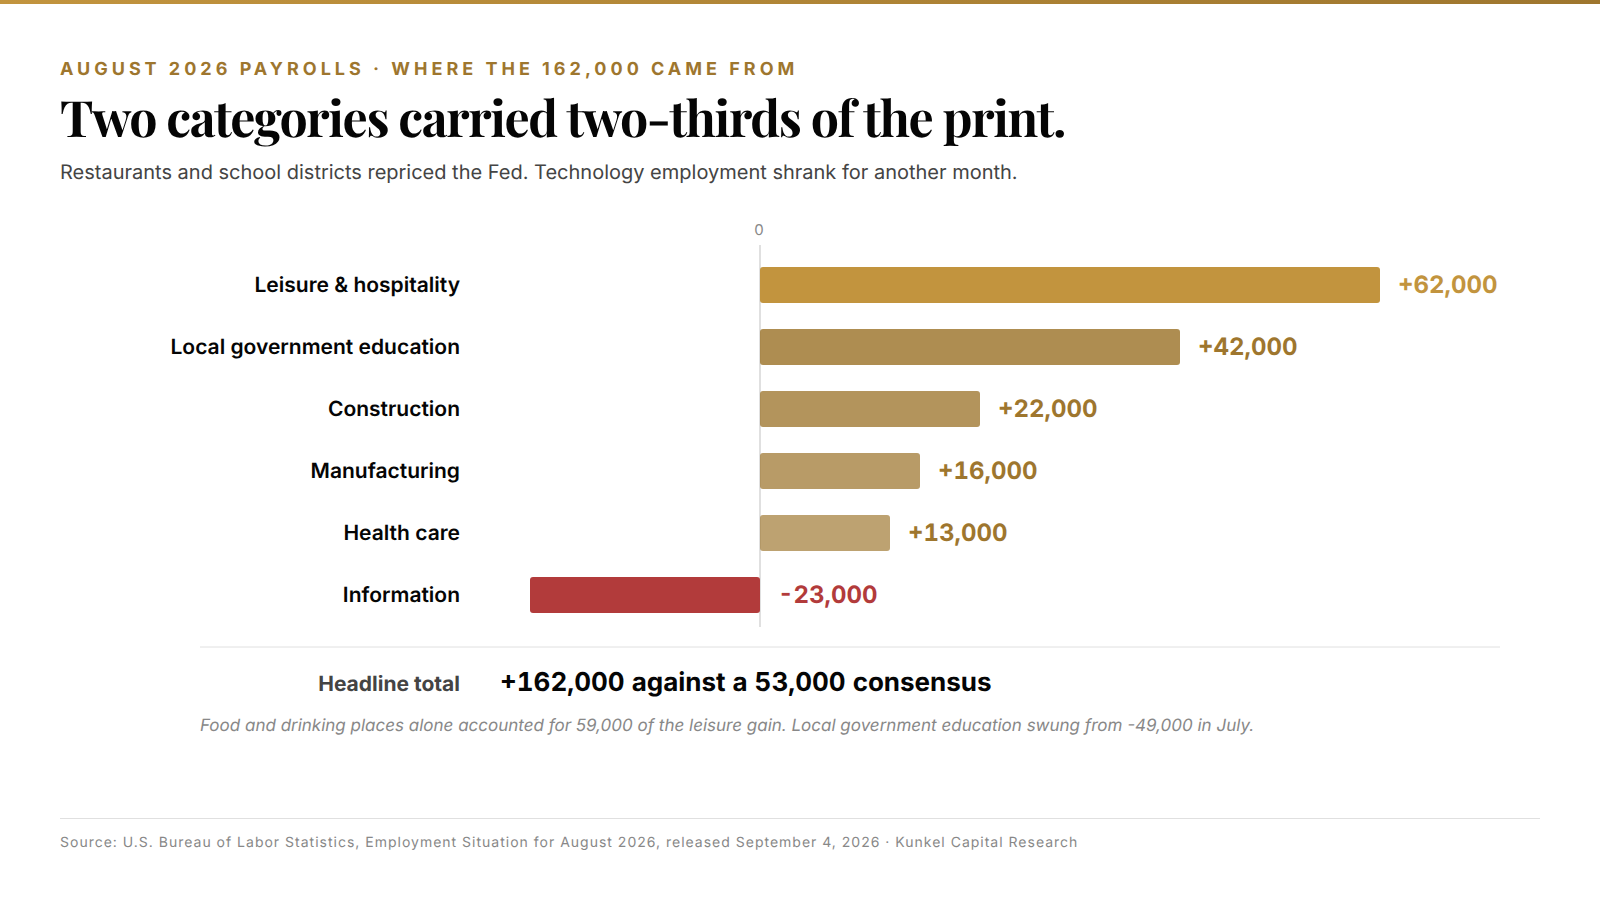
Translation: the print that repriced the Fed was a restaurant-hiring print and a school-district print. It said close to nothing about technology demand, and what it did say about technology employment was negative.
That gap matters for what comes next, because the Fed under Warsh is running an inflation-first reaction function. Composition does not enter the decision. A hot aggregate is a hot aggregate, and the August CPI on September 11 gets the last word.
Wages tell the same split story, since average hourly earnings rose 0.3% on the month and 3.1% on the year, which is firm without being alarming. So the print was hot enough to move the Fed and soft enough to leave the growth story intact, and that combination is exactly what an equity index wants.
Our July note on the 28,128 close is the control group, and the tape has flipped since
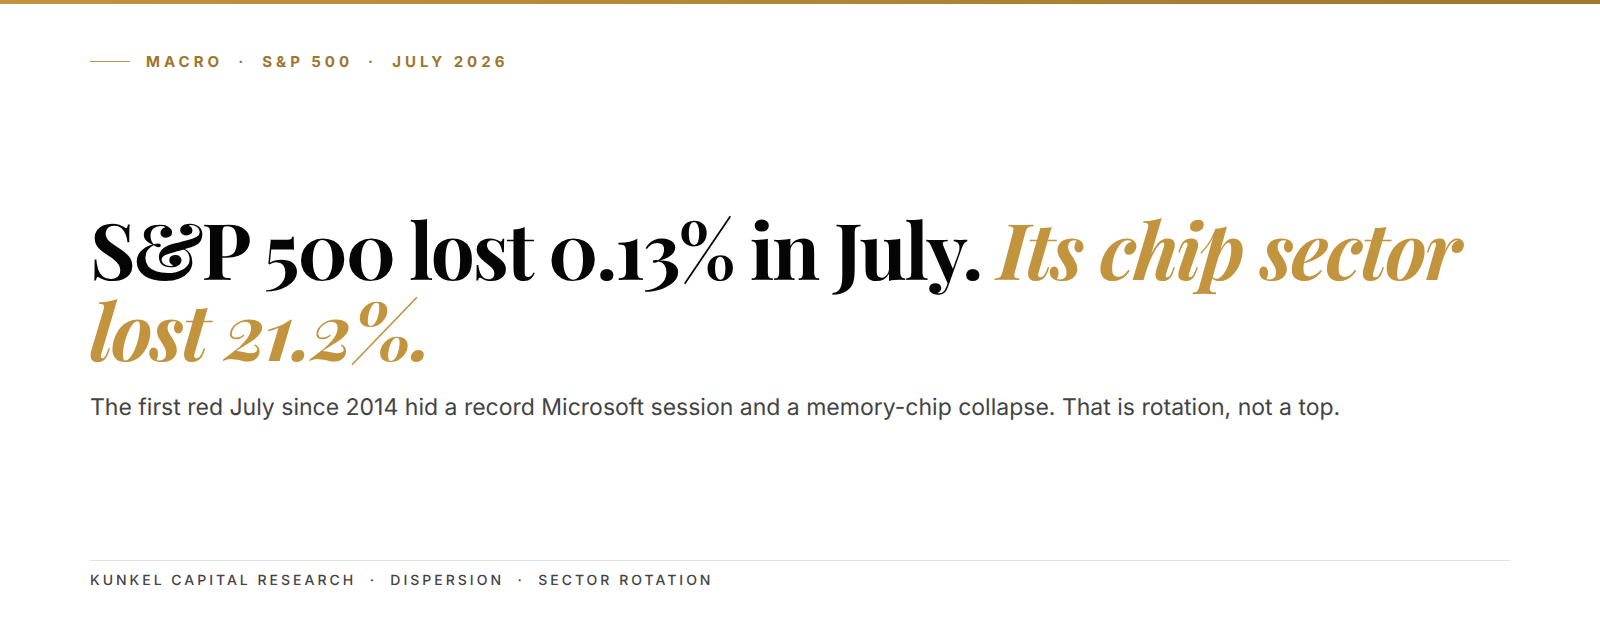
We wrote up the first version of this exact scare six weeks ago. On Friday, July 24, the Nasdaq 100 fell 1.15% to 28,128.34 with the 10-year at 4.7% and the market pricing a hike for the first time in two years. The read then was that the selloff was a duration trade wearing a semiconductor costume.
That read held, and then it stopped holding. Since July the yield has gone higher, not lower, to 4.78%. Hike odds have gone from a live possibility to a 62% favorite, and the index sits 5.0% above where it closed that Friday.
So the same input now produces the opposite output. In July, hawkish repricing sold the index. In September it did not. Nothing about the arithmetic of discounting changed in six weeks, which means the change has to sit somewhere else.
One correction to our own record, since it is part of the evidence. We had the July direction right and the durability wrong, because the call treated the duration channel as the dominant driver for the rest of the cycle. It was dominant for roughly three weeks. The 30,195 post-mortem covers what that cost and where the scorecard landed.
The discount-rate channel lost to the nominal-revenue channel
Two forces run in opposite directions on a print like Friday's. Higher yields raise the rate used to discount far-off profits, which marks down high-multiple growth first. But the same hot labor data also means more nominal income moving through the economy.
Think of the index as a toll bridge. The discount rate is what it costs the owner to finance the bridge, and nominal demand is how many trucks cross it. Higher financing costs hurt, yet more trucks help, and Friday's data raised both at once.
The vote went to the trucks, and there is a reason for that. Enterprise software and datacenter budgets are written in nominal dollars, so nominal growth funds them directly. At the same time the information sector cut 23,000 jobs, which is margin expansion showing up in the labor data before it reaches any income statement.
There is a second piece, and it is about the shape of the cash flows. Duration math bites hardest when profits sit far out in the future. But the largest names in this index are now printing cash today, not promising it for 2032, so the discounting horizon has shortened underneath the index while the multiple stayed high. A shorter horizon means less sensitivity to the long bond.
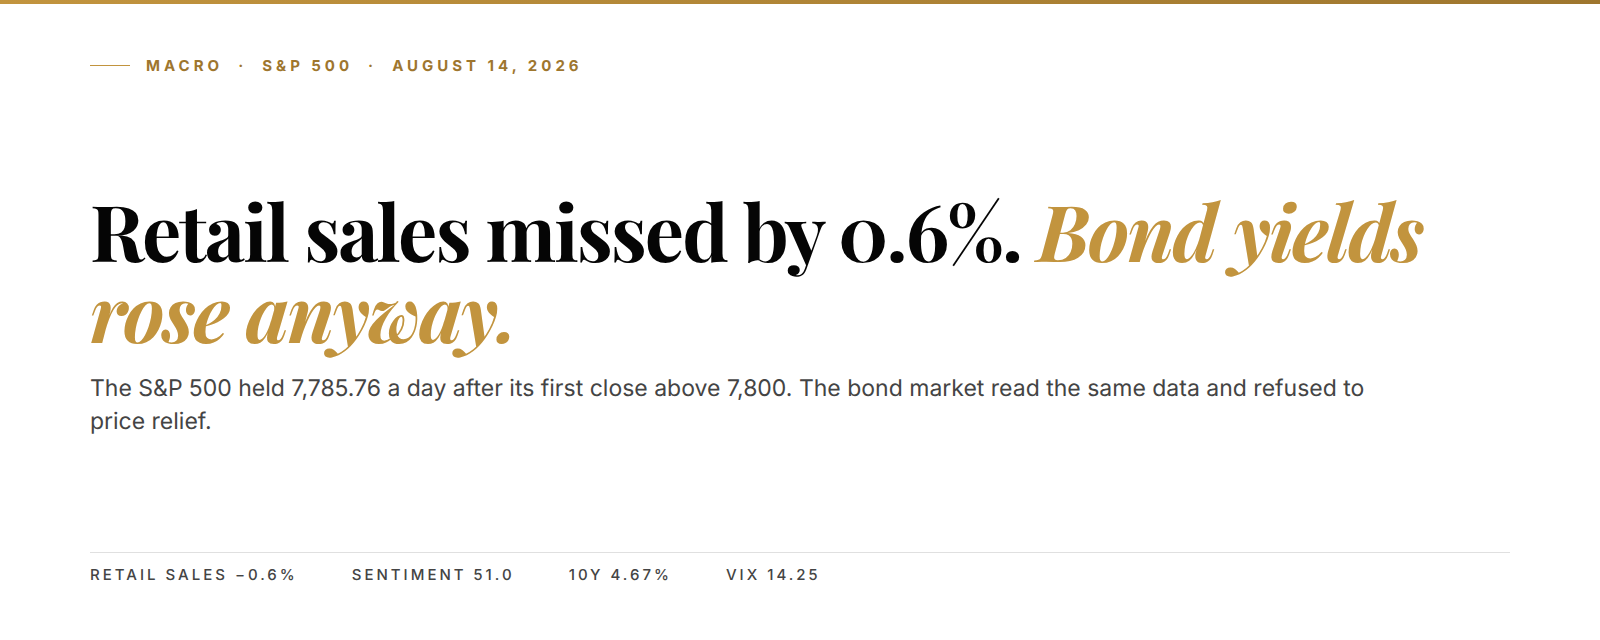
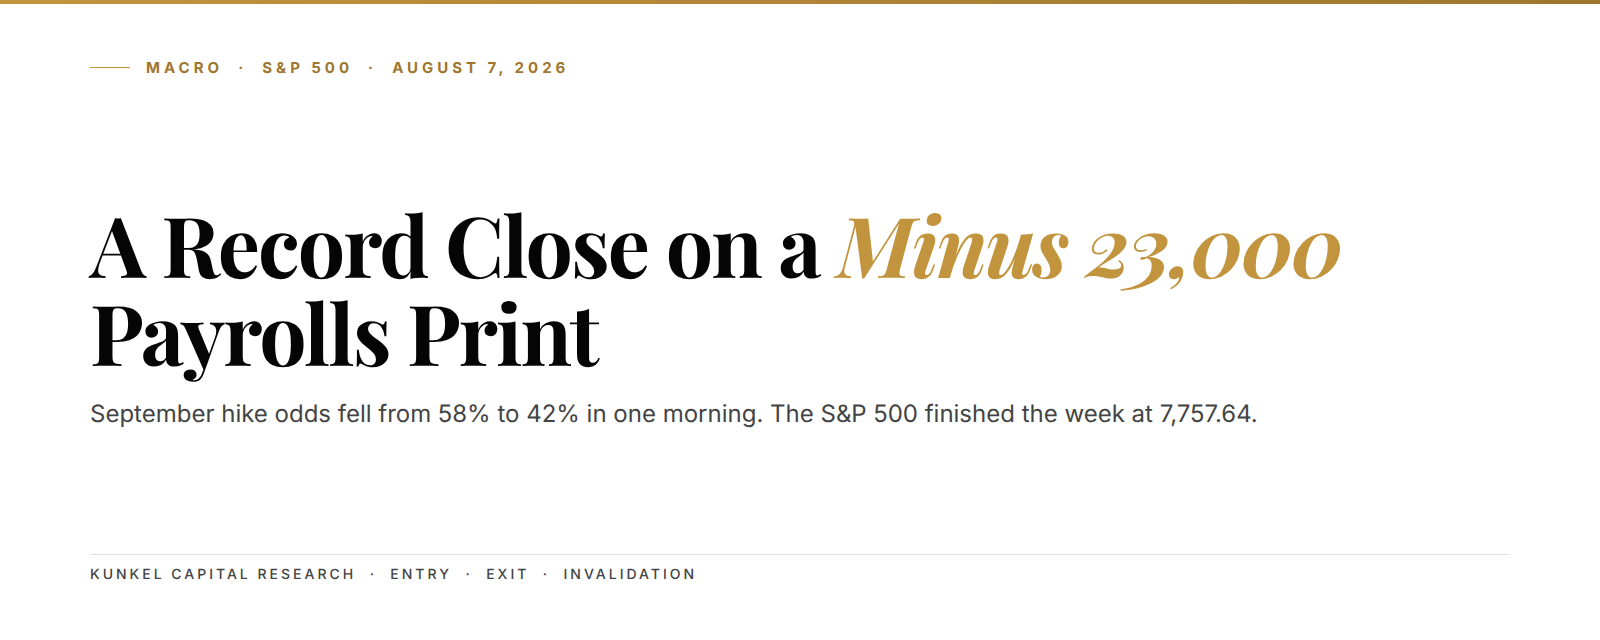
The Nasdaq 100 is one of the always-on assets on the Kunkel Capital rotation, and members get the full structure map with entry, exit and invalidation refreshed on a fixed cycle. Our August S&P 500 read worked the same mechanism from the other side, when a negative payrolls print produced a record close, and the two-year yield note tracked the front end doing the repricing.
Minus 23,000 information-sector jobs. The index rallied through a month when its own industry shed headcount, which is what margin expansion looks like before it reaches the income statement.
VIX at 14.53 into a September 11 CPI and a live FOMC is the cheapest part of this tape
Volatility is not paying attention. The VIX closed Friday at 14.53, within a point of its cycle low, with two binary events on the calendar inside two weeks. That is odd pricing for a market that assigns 62% odds to a rate hike.
The calendar does the rest of the work here. August CPI lands on September 11, and the FOMC decides on September 16 with a fresh dot plot attached. Warsh has declined to give forward guidance, so the meeting is genuinely open.
Where that leaves the index: 29,544.15 sits about 2.2% below the 30,195.7 high printed in August. The range since then has held, and every hawkish shove inside it has been absorbed rather than sold into.
14.53 on the VIX. Two weeks out from a CPI print and a live FOMC, and volatility is priced as if neither event is on the calendar.
Five things Friday actually settled:
- The hike is now the base case, not the tail, since rate futures moved from roughly 55% to 62% within hours of the 8:30 release.
- The labor market is not rolling over, because the two negative prints that argued otherwise were revised away.
- Breadth is poor, as two consumer-facing categories delivered about two-thirds of the 162,000.
- Technology employment keeps shrinking, with the information sector down 23,000 on the month.
- The index's rate sensitivity has fallen, and the green close is the evidence.
A correction that stops falling on bad news is a correction that is ending
Here is the full thesis, stated plainly. Since the August high the Nasdaq 100 has traded a range, and that range has now absorbed a hawkish Jackson Hole and a hot payroll print without giving way. Corrections end when bad news stops working, which is a pattern our wave-4 work keeps running into.
Friday was bad news that stopped working. That is behavior rather than forecast, and behavior is the part you can observe in real time. So the structural read favors this range resolving higher rather than rolling into a trend reversal, as long as hawkish shoves keep failing to produce real distribution.
We are not certain the CPI cooperates, and that is the honest gap in this read. A hot August inflation print on September 11 would hand the hawks a second win inside a week. Two wins in a row is a different test than one, and the gold flush post-mortem shows how fast that channel can reassert itself in metals.
So here is where the thesis breaks. A daily close back below the September 1 low at 29,077.22, while the 10-year pushes through the 4.80% area it has now stalled at three times, would say the discount-rate channel took back control. Until you see that pair together, Friday's tape stands as evidence it has not, and the term-premium note explains why the long end is the half that matters.
Frequently asked questions
Why did the Nasdaq 100 rise when rate-hike odds went up? Because the same data that raised the discount rate also raised expected nominal revenue. Enterprise and datacenter budgets are set in nominal dollars, so a hot labor print helps fund them. On Friday the revenue channel outweighed the rate channel.
Will the Fed hike on September 16, 2026? Rate futures put it near 62% after the August employment report. The August CPI on September 11 is the last major input before the decision. Chair Warsh has not committed to guidance, so the meeting is live.
Was the August jobs report actually strong? The headline was, at 162,000 against a 53,000 consensus. But the composition was narrow, since leisure, hospitality and local government education carried most of it. The information sector lost 23,000 jobs.
What would change the read on the Nasdaq 100? A daily close under the September 1 low while the 10-year clears the 4.80% area it has stalled at. That combination would show the index trading on rates again.
How does this compare with the July rate-hike scare? In July the index fell 1.15% to 28,128.34 on the same fear. It now sits 5.0% higher with yields and hike odds both higher, so the reaction function has changed.
Know your entry, your exit, and where you are wrong on the Nasdaq 100
Friday's green close on a 62% hike day is the surface signal. The Nasdaq 100 is on the Kunkel Capital watchlist: the full research maps the current wave count to a defined entry zone, an exit target and the exact invalidation level, refreshed on a fixed rotation, with alerts when levels hit. €19.99 first month, then €34.99. Cancel anytime.
Sources: U.S. Bureau of Labor Statistics Employment Situation, September 4, 2026; Federal Reserve Board, Chairman Warsh Jackson Hole remarks, August 28, 2026; Reuters rate-futures pricing.
Last updated: 2026-09-07