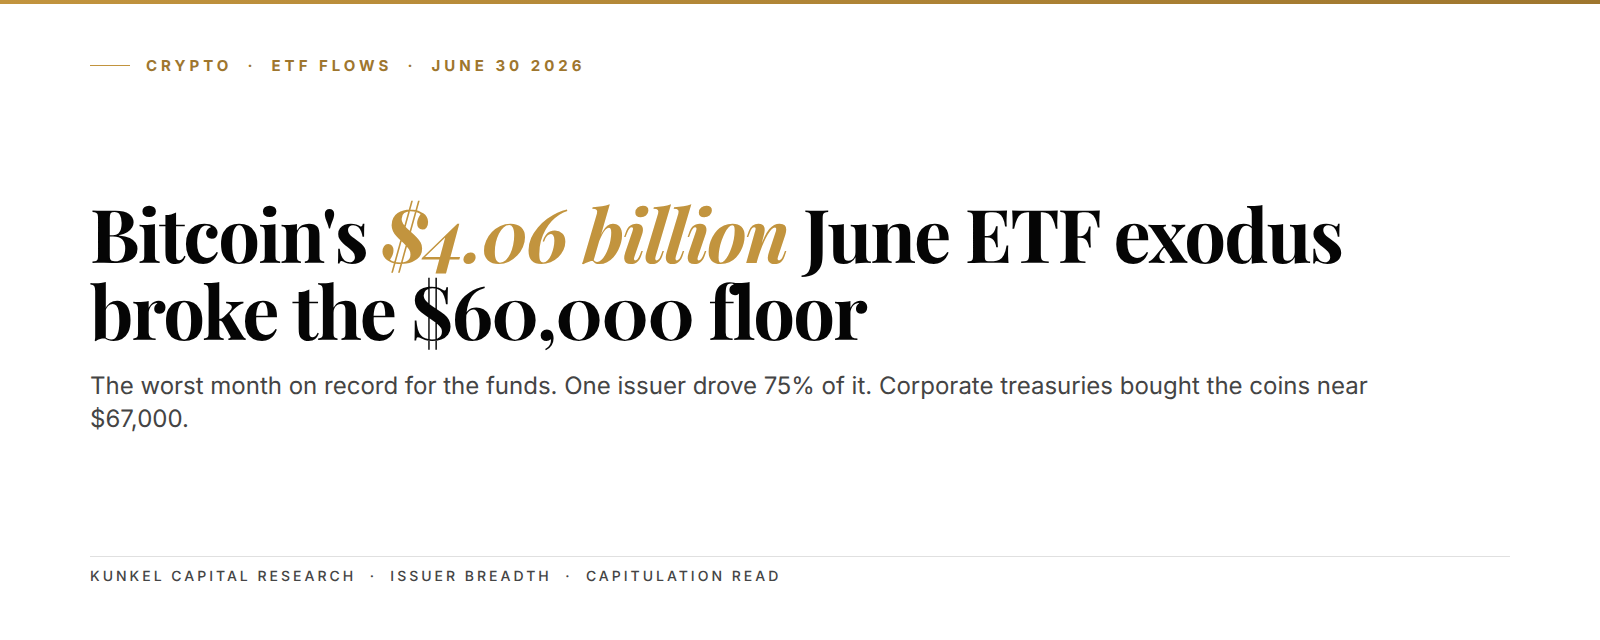
Bitcoin closed June under $60,000 for the first time since 2024, and its spot ETFs just booked their worst month ever: $4.06 billion pulled out. The month-end print landed on Tuesday, June 30. Every headline used one word. Capitulation.
Here's the problem with that read. One big number hid what actually happened underneath it, and the detail is where the whole trade lives this quarter.
A spot Bitcoin ETF is a fund that holds real bitcoin and trades on a stock exchange, so its daily flows show whether large institutions are adding or dumping. Those flows just told a lopsided story this week. One giant fund did most of the selling. Corporate treasuries stepped in to buy the coins it handed back. That split is the whole thing.
The setup in 3 lines:
- US spot Bitcoin ETFs bled $4.06 billion in June, the biggest month since the funds opened in January 2024.
- BlackRock's IBIT drove roughly 75% of that, near $3.3 billion, so the exit was concentrated, not broad.
- The $60,000 weekly close flipped former support into resistance, and that level now sits stacked with put options.
Now the part consensus skipped. On June 30, with the tape still red, corporate treasuries kept buying bitcoin near a $67,000 average cost. Compass Point Research flagged long-term holders selling into the rally and called it "late-cycle" behaviour. Two desks, two opposite reads, same week. That tension is the trade.
$4.06 billion is the biggest ETF month since the funds opened in 2024
The redemptions were real. US spot Bitcoin ETFs lost money across June and finished the month down $4.06 billion. That is the heaviest total since the funds first launched in January 2024. It beat the old record of $3.56 billion set back in February 2025. Bloomberg confirmed the figure at the June 30 close.

The pace tells you more than the total does. Between June 22 and June 26 alone, the funds shed $1.79 billion. That was one of the largest single weeks on record. At one point seven straight sessions printed net redemptions. The worst single day pulled $696.3 million.
Stack May on top and the retreat gets clearer. May had already booked $2.43 billion in outflows, so the two months together pulled close to $6.5 billion out of the wrappers. That is roughly a quarter of the peak fund balance walking out the door in about six weeks. Redemptions of that size do not happen in a market that feels calm about the next leg lower.
Translation: a lot of paper hands left in a hurry. The screen was not lying about the fear.
BlackRock's IBIT drove 75% of the exodus, so the panic was narrow
Here's the number consensus missed. One fund did most of the damage. BlackRock's IBIT accounted for roughly $3.3 billion of the June total. That's about 75 cents of every dollar redeemed.
That concentration changes the story, and it changes how you size risk into the next leg. A broad panic looks like every issuer bleeding at once. This did not look like that. Fidelity's FBTC, Ark's ARKB, and Bitwise's BITB moved small numbers next to IBIT's exit. When one desk drives three-quarters of a month, you are watching one large holder rotate its book, not a whole crowd stampede for the door.
Think of it like a single tenant breaking a lease in a full building. The lobby looks empty for a day. The other ninety units never moved. The vacancy sign says more about one tenant than the whole block.
We have seen this shape before. The last time the tape flashed red while the bid quietly broadened, four issuers turned buyers at the capitulation low. Issuer breadth is the tell. It is the same lens we used when the bid returned during the earlier ETF exodus, and it is why we watch how ETF flows now drive price discovery.
75 cents of every dollar. That is how much of June's $4.06 billion exit came from one fund, IBIT, not from the whole market.
Bitcoin's weekly close under $60,000 flipped the floor that held every 2026 low
Now the price. Bitcoin traded near $59,270 on Tuesday, June 30, and closed the second quarter below $60,000. That level had held every single low in 2026 until this week. Cross it on a weekly close, and old support becomes new resistance.
The break was not clean or slow. Bitcoin first cracked $60,000 on June 24, its lowest since late 2024. It bounced to $61,000 the next day, then got sold again into quarter-end. Traders who bought that first bounce got run.
The flip matters because of where the coins sit on the tape. Every buyer who stepped in above $60,000 this year is now offside on the position. Each rally back toward that line meets a wall of people who just want out at break-even, and that supply is exactly what caps a bounce.
Translation: the floor became a ceiling. Sellers now live where buyers used to.
The mechanical question of where a market has to reclaim ties straight into how realized price marks cycle bottoms.
Long-term holders started selling, and Compass Point calls it late-cycle
Here's the uncomfortable part. The steady hands moved. Compass Point Research pointed to selling from long-term holders, wallets that have held six months or more. It described the pattern as "a typical sign of late-cycle capitulation."
That read is the one we least want to wave off. Long-term holders usually sit still through drawdowns. When they hand coins to the market, it often marks the messy back half of a decline, not the clean start of one. So we take it seriously.
But we will hold one doubt out loud. "Late-cycle" is a label, not a level. It fits a top and it fits a final flush equally well, and nobody rings a bell to tell you which. That same on-chain cohort has sold into strength near local bottoms before, once the illiquid supply stops shrinking.
So the honest position is a range, not a point. More on that below.
$1.2 billion in $60,000 put options turns the old floor into a magnet
Here's the mechanical piece under the price. Deribit, the largest crypto options venue, shows more than $1.2 billion in open interest sitting on the $60,000 put strike. A put is a contract that pays out if price falls below a set level. A wall of them clusters attention right there.
Those options do not just sit quietly. Dealers who sold them hedge by selling futures as price drops toward the strike. That selling can drag the market the last few percent into the level. The wall becomes a magnet.
Think of it like a drain at the low point of a yard. Water does not choose the drain. The slope sends it there. The $60,000 strike is the drain, and dealer hedging is the slope.
Translation: big option walls can pull price toward them. This one sits right under the market.
That reflexive loop is the same one we track through perpetual funding at capitulation lows.
Corporate treasuries bought the coins the ETFs handed back near $67,000
Here's the divergence that defines the month. While the ETFs redeemed, corporate treasuries kept buying. The coins the wrappers handed back did not vanish. They moved onto balance sheets at an average cost near $67,000.
That is a different kind of owner sitting on the coins now. An ETF investor can sell the whole position with one click on a bad morning. A corporate treasury that bought bitcoin as a long-term reserve asset tends to sit through drawdowns and keep the coins off the market. So the float quietly rotated from fast hands to slow ones across this quarter, and that rotation tightens the tradable supply.
Five points frame where this leaves the tape:
- June ETF outflows hit $4.06 billion, a record, but 75% came from one issuer.
- Corporate buyers absorbed coins near a $67,000 cost basis, above spot.
- Long-term holders sold into strength, a late-cycle warning worth respecting.
- The $60,000 weekly close flipped support into resistance.
- A $1.2 billion put wall sits on the $60,000 strike as a downside magnet.
$67,000. That is the average price corporate treasuries paid for coins the ETFs were dumping below $60,000.
Translation: the weak hands sold low and the patient hands bought higher. That rotation is what a bottoming process looks like, not a ringing bell.

What we're watching: capitulation is a process, not a $60,000 print
So where does this leave the read. Capitulation is rarely one candle. It is a process, and the tape looks mid-process, not obviously finished.
We want three things before calling the low. First, issuer breadth: the IBIT selling has to thin while smaller funds turn buyers, the exact split that marked the last bottom. Second, a weekly reclaim of $60,000, which would flip the ceiling back into a floor. Third, the long-term holder cohort has to stop distributing coins.
Until those line up, you respect the $60,000 put wall as a magnet and the late-cycle warning as real risk. The zone that matters sits between the low-$50,000s, where prior cycle math clusters, and the $60,000 reclaim line above. That band is the whole decision.
You do not need to guess the exact coin. You need the level and the flow to agree. Right now they do not, and that gap is the setup.
See the full Bitcoin capitulation setup
The $4.06 billion outflow and the $60,000 break are the surface signals. The Kunkel Capital research adds the issuer-breadth flow map, the on-chain realized-price zones, the Deribit put-wall levels we are tracking, and the sized entry band we are stalking into Q3. €19.99 first month, then €34.99. Cancel anytime.
Frequently asked questions
Why did Bitcoin ETFs see $4.06 billion of outflows in June 2026?
The outflows built through the quarter as institutions cut exposure and one large holder, BlackRock's IBIT, rotated out. IBIT alone drove about 75% of the $4.06 billion, so the month was concentrated rather than a broad exit.
Is the $60,000 level still important for Bitcoin?
Yes. Bitcoin closed under $60,000 on a weekly basis for the first time since 2024, flipping former support into resistance. A weekly reclaim would turn the level back into a floor, which is why traders watch it so closely.
What does "late-cycle capitulation" mean here?
Compass Point Research used the phrase to describe long-term holders, wallets held six months or more, selling into strength. It points to the messy back half of a decline. It is a warning, not a precise timing tool.
Who was buying while the ETFs sold?
Corporate treasuries kept adding bitcoin near a $67,000 average cost. That moved coins from fast-moving ETF investors to slower balance-sheet holders during the June selloff.
Does a record outflow month mark the bottom?
Not on its own. A durable low usually needs issuer breadth to turn, a weekly reclaim of $60,000, and long-term holders to stop selling. As of July 2026, those signals have not lined up yet.
Last updated: 2026-07-01