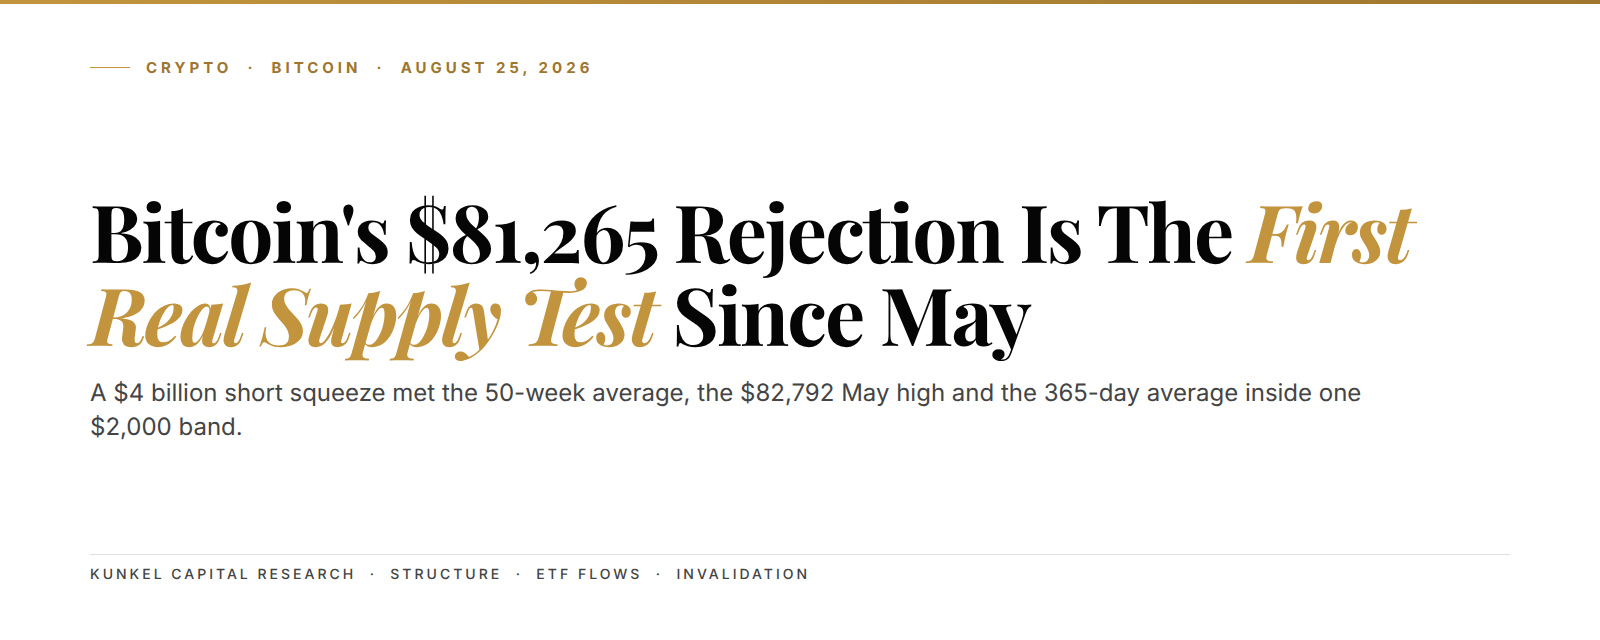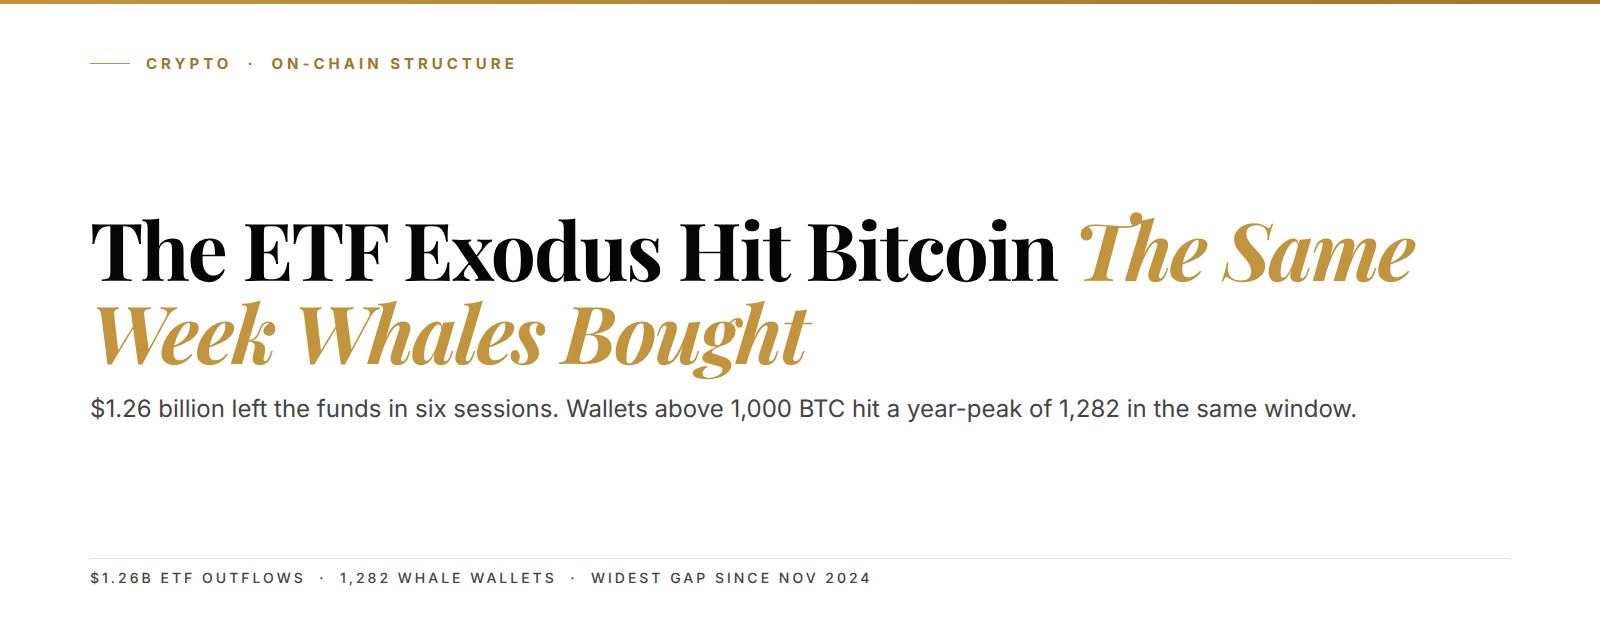
Bitcoin tested $74,500 on Friday, its lowest print in two months. Spot Bitcoin ETF holders pulled $1.26 billion over six straight sessions. That almost erased every dollar of net inflow the year had banked. A whale-versus-retail divergence, when large on-chain wallets buy while fund investors sell, splits Bitcoin demand into two opposing flows. That is exactly what printed this week. Net inflows for 2026 now sit at $536 million, down from $2.44 billion in April alone. Yet wallets holding 1,000 or more BTC climbed to 1,282 on May 22, matching the year's peak. The crowd sold the screen. The whales bought the coin.
The setup in 3 lines:
- ETF desks dumped $1.26 billion in six sessions while wallets above 1,000 BTC added supply into the drop.
- The gap between paper sellers and on-chain buyers is the widest since November 2024.
- A $74,500 floor that holds while whales accumulate is the kind of base that tends to precede the next leg, not the breakdown the tape is pricing.
Here is the moment that frames the whole week. On Friday, BlackRock's IBIT, the largest spot Bitcoin fund on the planet, led the bleed with a $68.9 million single-day outflow. Fidelity's FBTC shed another $36.3 million the same session. Two of the biggest names on Wall Street were handing back coin. And the on-chain ledger, in the same 24 hours, showed large wallets quietly taking the other side.
So which buyer do you trust: the one selling on the screen, or the one buying the coin?
The $1.26 billion ETF exodus nearly wiped out Bitcoin's entire 2026 inflow
ETF flows turned ugly fast. Over six consecutive sessions into May 23, US spot Bitcoin ETFs lost $1.26 billion. That is the kind of streak that erases a quarter of work in a week. April had been a banner month, with $2.44 billion pulled in, nearly double March's $1.32 billion. Most of it is gone now.
The math is brutal when you stack it. Year-to-date net inflows dropped to $536 million after the streak. The single worst day was May 13, when the funds bled a record $635 million in one session. Between May 11 and May 15, the funds lost roughly $1 billion, the largest weekly outflow since February.
Translation: the ETF crowd that piled in during April spent May running for the door. By Friday, almost the entire year of fund buying had been handed back.
$536 million. That is all that's left of Bitcoin's 2026 ETF inflows after a $2.44 billion April.
This is the number the bearish tape is built on. If you only watch ETF flows, Bitcoin looks like a trade that's quietly dying. We read it differently, and the reason sits one layer down, on the chain itself.
Macro did the selling: a 5.198% long bond and a 3.8% CPI
Three macro forces hit risk assets at once. The April CPI, the government's monthly inflation gauge, ran at 3.8%, the hottest since September 2023. The Producer Price Index, which tracks prices at the factory gate before they reach you, jumped to 6%. And the 30-year Treasury yield pushed to 5.198%, near a 12-month high.
Higher yields are the real pressure here. When a government bond pays north of 5% with no price risk, the bar for owning a no-yield asset like Bitcoin goes up. Money managers running ETF mandates rotate first. They sold.
Hopes for a near-term rate cut shrank too. With incoming Fed chair Kevin Warsh seen as less dovish, the market stopped pricing relief. The one offset came from oil: Brent crude dropped 5% on news of a possible Strait of Hormuz reopening, which cooled the inflation-through-energy story that had been pressuring everything.
Translation: bonds got more attractive, inflation stayed hot, and the rate-cut bet evaporated. Fund money does what fund money does in that setup. It sells the speculative stuff first.
If you want the bond side of this story, our note on Japan's 40-year yield repricing the global cost of money maps why the long end matters more than the headlines suggest.
Whale wallets hit 1,282 in the same week the ETFs bled
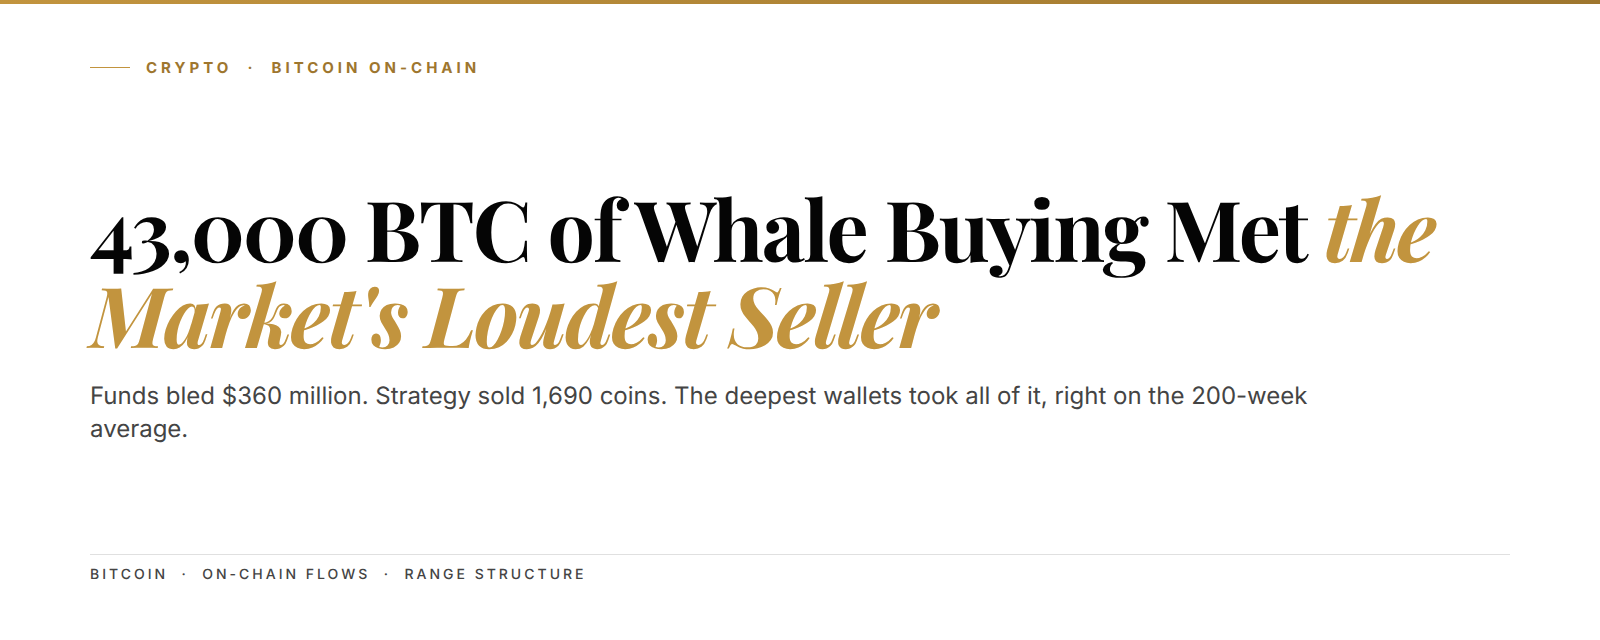
Now the part nobody put on the front page. While the funds sold, the biggest holders bought. Wallets holding 1,000 or more BTC climbed to 1,282 on May 22, matching the year's peak set on May 3. These are the entities people call whales, the addresses with serious size.
It goes deeper than a single tier. Addresses holding 100 or more BTC reached 20,229 wallets, a multi-year high. Over the past month, this group added roughly 270,000 BTC, about $23 billion at current prices. That is close to 1.3% of all Bitcoin in circulation, and it ranks as the largest net purchase by large holders in over 13 years.
270,000 BTC. That's what large wallets bought in a month the ETFs were dumping, the biggest such grab in 13 years.
Think of it like a city block during a panic. The shop-window crowd sees the for-sale signs and runs. The landlord who owns half the street uses the dip to buy two more buildings. The ETF tape is the shop window. The whale wallets are the landlord.
Translation: the loud money was selling. The quiet money was buying more than it has in over a decade. Same week. Same coin.

Two buyers, two clocks: why ETF flow and on-chain flow can split
These two flows answer to different clocks. ETF flow is a daily-mark, mandate-driven number. A pension allocator or a wealth desk rebalances when yields move or risk budgets tighten, and the redemption hits the tape that afternoon. On-chain accumulation runs on a multi-quarter clock. A whale building a position over months doesn't care about Tuesday's close.
Since the January 2024 spot ETF launch, the marginal Bitcoin buyer shifted onto Wall Street's clock. We wrote about that shift in how ETF flows now drive Bitcoin price discovery. The screen price is set by US market hours and fund desks now, not by Asian-session crypto exchanges.
That's the catch. When the ETF clock sells hard, the screen price drops even as on-chain demand strengthens. The price you see reflects the impatient buyer. The supply leaving exchanges reflects the patient one.
Here's the self-correction, because the clean version is too clean. Not every whale wallet is a long-term believer. Some 1,000-BTC addresses belong to exchanges, custodians, or market makers parking inventory, so the count overstates pure conviction. We adjust for that, and the signal still holds. The on-chain buying is real and it's large.
The whale-versus-retail gap is the widest since November 2024
The divergence itself is the signal. A whale-versus-retail divergence happens when large on-chain wallets accumulate Bitcoin at the same time fund and retail holders sell, pulling demand into two opposing directions. As of May 22, 2026, that gap is the widest it has been since November 2024.
You might remember what followed November 2024. So do the whales. That's the entire reason the accumulation matters: the last time this split ran this wide, the patient side got paid.
We run a five-point filter on these divergences before we treat one as a floor signal. Here is the version we can show in public:
- Large wallets (1,000-plus BTC) must be rising, not flat, into a price drop
- The 100-plus BTC cohort must confirm, not contradict, the top tier
- ETF outflows must be macro-driven, not a Bitcoin-specific shock
- Price must hold a prior structural floor on a closing basis
- The divergence must rank in the top decile of the trailing two-year range
This week's tape clears all five. The whale count is rising. The 100-plus cohort sits at a multi-year high. The outflows trace to yields and CPI, not a hack or a regulatory hit. The $74,500 floor held into the weekend. And the gap is the widest in 18 months. This is the same family of smart-money-versus-crowd extreme we track across assets, the one our COT commercial hedger work found marked eighteen of twenty-two major commodity lows since 2010.
Translation: every box we check before calling a floor is checked. That doesn't promise a bottom. It stacks the odds.

What a $74,500 floor that holds under whale buying actually sets up
The structural read starts with the floor. Bitcoin opened the week at $77,200, ran to $78,300 on May 20 to 21, then sold off to $74,500 by May 23 before recovering to $76,610. The $74,500 print is the lowest in two months, and it held. A floor that holds while the strongest hands add supply is a base, not a breakdown.
But here's the honest risk, and we've watched it bite. A divergence this clean can still fail if the macro gets worse. We flagged a palladium capitulation long that never fired when the setup looked textbook and the trigger never came. If the 30-year yield rips through 5.4% or CPI reaccelerates, the whales can be early and the floor can crack. Early is not the same as wrong, but it costs you.
The constructive case is the cleaner one for now. If $74,500 holds on a weekly close and the whale count keeps climbing, the path of least resistance points back toward the $78,000 to $80,000 shelf that capped the week. That is the retest logic we apply across setups, the same structure behind our gold-silver ratio snap-back read and our copper deficit retest.
The screen says Bitcoin is fading. The chain says the people with the most at stake are buying it. When those two disagree this loudly, you watch the chain.
That's the entire game.
Frequently asked questions
Why did Bitcoin ETFs see $1.26 billion in outflows in May 2026?
The outflows traced to macro, not to Bitcoin itself. April CPI ran at 3.8%, the 30-year Treasury yield pushed to 5.198%, and rate-cut hopes faded under incoming Fed chair Kevin Warsh. Higher yields make a no-yield asset less attractive to mandate-driven fund desks, so they rotated out first.
What does whale accumulation mean for Bitcoin's price?
Whale accumulation means wallets holding 1,000 or more BTC are buying. In May 2026, that count hit 1,282, and large holders added roughly 270,000 BTC in a month, the biggest such purchase in 13 years. Heavy accumulation into weakness has historically marked durable floors, though it never guarantees the exact bottom.
What is a whale-versus-retail divergence?
It is when large on-chain wallets accumulate Bitcoin while ETF and retail holders sell, splitting demand into two opposing flows. As of May 22, 2026, the gap was the widest since November 2024, which signals smart money buying while the crowd capitulates.
Is the $74,500 level important for Bitcoin?
The $74,500 print on May 23, 2026 was Bitcoin's lowest in two months, and it held into the weekend before a recovery to $76,610. A floor that holds while whales accumulate tends to act as a base rather than a breakdown, though a weekly close below it would change the read.
See the full Bitcoin divergence setup
The $1.26 billion ETF exodus against 1,282 whale wallets is the surface signal. The Kunkel Capital research adds the exact wave count on the $74,500 base, the Fibonacci retracement zones for the recovery, the multi-quarter target shelf, and the divergence filter scored week by week. €19.99 first month, then €34.99. Cancel anytime.
Last updated: 2026-05-27. Not investment advice. Kunkel Capital Research publishes daily market-structure work built on Elliott Wave and Fibonacci analysis.