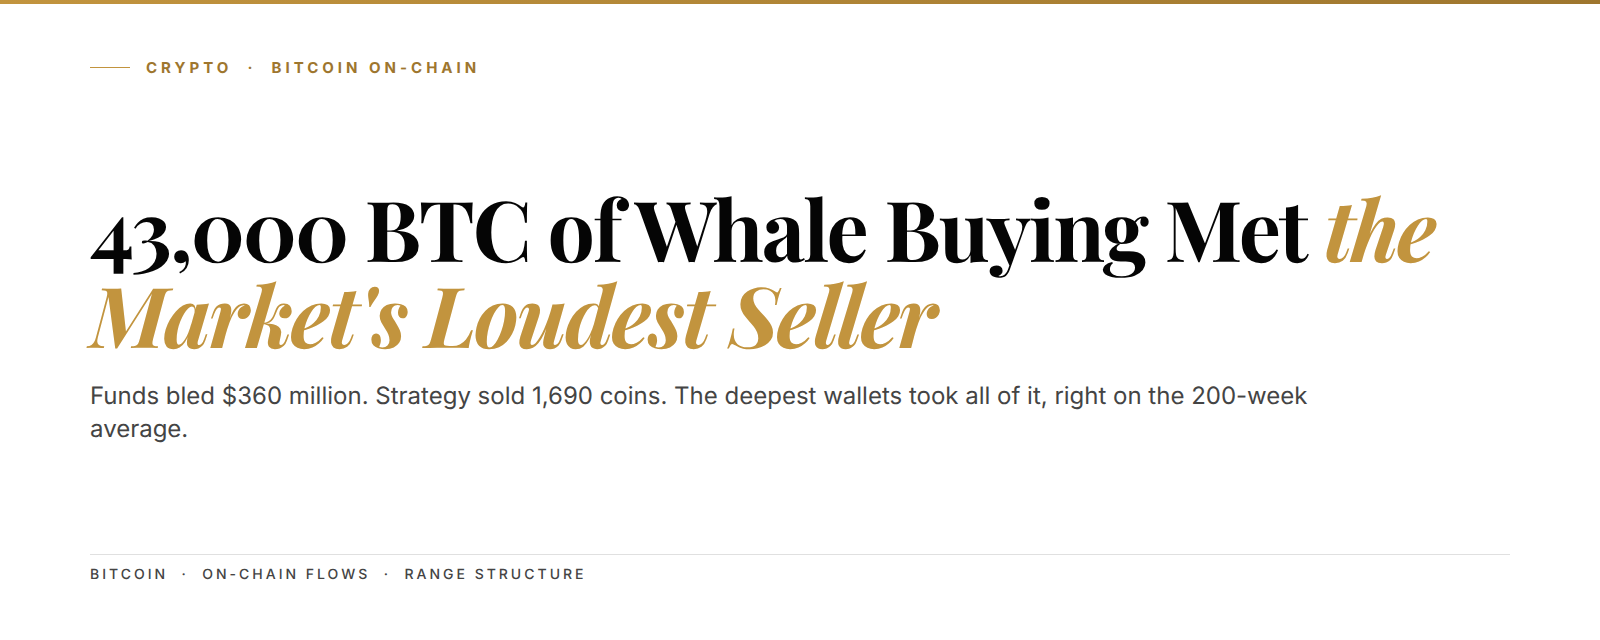
Bitcoin traded down to $62,687 on Monday, then closed the session back at $64,506, up 2.3% on a day the S&P 500 fell 0.4%. The bounce had a buyer behind it. CryptoQuant data released this week shows large holders added a net 43,000 BTC over the past 60 days, worth roughly $2.75 billion. Consensus says there's no bid left in this market, and crypto fund products did bleed another $360 million last week. The chain says consensus is reading the wrong ledger.
---
The setup in 3 lines:
- Whale wallets added a net 43,000 BTC in 60 days per CryptoQuant, and the buying started near $60,000.
- Strategy, the largest corporate holder, sold 1,690 BTC at an average of $64,262 between August 3 and August 9.
- Price is sitting on the 200-week moving average near $64,000, the line that ended every prior Bitcoin bear.
Bitcoin is holding $64,000 because whale wallets are absorbing more coin than the fund wrappers are giving up. That's the whole story in one sentence, and it comes with a stat that shouldn't coexist with it. Glassnode counts just one day in three over the past quarter where Bitcoin beat the S&P 500, the weakest relative stretch since 2018. So the tape is weak, the paper selling is heavy, and the deepest pockets in the market are buying all of it. Something has to give.
Whale wallets absorbed 43,000 BTC while fund products bled $360 million
CryptoQuant tracks the balances of large holders after stripping out exchange and miner addresses, and that cohort added a net 43,000 BTC over the past 60 days. The buying began when price steadied near $60,000 in early July. It hasn't stopped since.
One number needs a definition before it can carry weight. Net accumulation means coins added minus coins sold across the whole cohort, with exchange and miner wallets stripped out of the count. So the 43,000 figure isn't gross buying, it's what stuck. In a market this quiet, what sticks is the signal.
Glassnode's cohort data shows the same thing from a different angle. Wallets holding 100 to 1,000 BTC have been steady buyers since late July, and the wallets above 10,000 BTC joined them in August. Glassnode analyst Sean Rose called it "a broad-based resumption of buying across all holder tiers," which matters because cross-cohort buying is rare inside a consolidation.
The fund wrappers tell the opposite story. Bitcoin investment products shed roughly $360 million in the week through August 15, per CoinShares flow data, extending the streak we mapped in the ETF exodus piece. Translation: the selling lives inside the ETF wrapper, while the coins themselves keep migrating into bigger wallets. The two ledgers disagree, and one is wrong.
43,000 BTC. Net whale accumulation over 60 days, per CryptoQuant. The fund flow tape shows none of it.
If you only watched the ETF tape this month, you'd have called this market abandoned. On-chain, it's the broadest accumulation window since spring. The timing is the tell here, because these wallets are adding while sentiment sits in the gutter, and stablecoin mints tend to front-run exactly this kind of absorption.
Strategy sold 1,690 BTC at an average of $64,262 and the market absorbed it
Now the seller, and it's the loudest name in the market. Strategy is the Michael Saylor firm that turned corporate Bitcoin buying into a business model. On Monday, August 10, it disclosed the sale of 1,690 BTC for $108.6 million. The coins went out between August 3 and August 9 at an average price of $64,262, and that followed an earlier sale of roughly 1,638 coins in late July.
The cash isn't leaving crypto on a whim. Strategy owes dividends and buybacks on its STRC preferred stock, and the coin sales fund those obligations after a seven-week pause in purchases. The firm still holds 842,138 BTC, so this is a trim rather than a liquidation. That distinction matters more than the headline. But the signal cuts either way, because the most reliable bid of the last cycle just flipped to supply.
Here's the part that matters for structure. The market took Strategy's coins during the exact window the whales were building, and price finished that August 3 to 9 stretch higher on the daily closes. When forced selling from the loudest holder can't push price out of the range floor, the absorption underneath it is real.

Price barely even noticed the extra supply.
842,138 BTC. What Strategy still holds after the August sales. The sales funded preferred dividends, not a thesis change.
515,000 BTC changed hands within a thousand dollars of the 200-week average
Glassnode's supply data shows where the absorbed coins landed. Roughly 515,000 BTC changed hands near $63,000, and another 362,000 coins sit clustered a couple thousand dollars lower. Add it up and more than 5% of all Bitcoin has re-priced inside one narrow band since June. That's a base being built, not an accident.
The band matters because of what runs through it: the 200-week moving average, which sat at $63,657 in early August and is drifting higher through the mid-$64,000s now. Every Bitcoin bear market since 2015 has ended at or on this line. The 2018 low formed against it, the March 2020 crash pierced it for about a week, and the 2022 bottom held under it for months before turning.

Think of the 200-week average as the average price paid across one full four-year cycle. Trading at it is like a stock trading at book value, and nobody rings a bell to tell you the day it turns. The line isn't magic, and it won't time anything for you. It simply marks what a full cycle of holders paid. We flagged the same long-cycle math when realized price marked the cycle bottom zone, and the market keeps respecting it, just as it respected the $60,000 floor through the hawkish Fed stretch.
The range runs $62,200 to $66,400 and August volume is the thinnest since 2021
The consolidation comes with clean walls on both sides. Bitcoin tagged $66,400 on July 21 and got sold, faded again from $65,400 a week later, and probed $62,400 in early August. Monday's dip to $62,687 was another test of the same floor region, a pattern that showed up when the $62,542 floor held three tests into payrolls. Nobody has had the size to force a break yet, so the range keeps holding.
Momentum is being honest about the fatigue. The weekly RSI (a momentum gauge where 50 is neutral) reads 38.8, and August spot volume is running at its lowest level for the month since 2021. On top of that, perpetual funding rates (the fee traders pay to hold long futures positions) just hit a 20-month high, the kind of crowding we broke down in the funding-at-capitulation study.
And there's a counter-signal we won't dress up. Santiment shows exchange balances back at 1.332 million BTC as of August 16, which retraces the 33,000 coins that left exchanges between mid-June and late July. Coins moving toward exchanges often front-run selling, so this deserves respect. Wait, actually, Santiment itself adds the caveat: inflows also come from market makers staging inventory ahead of volatility, so the read stays genuinely open until the range resolves.
1.332 million BTC. Exchange balances as of August 16, back at pre-July levels. The one signal arguing against the whales.
Bitcoin is one of the assets on the Kunkel Capital rotation: members get the full structure map with entry, exit and invalidation refreshed on a fixed cycle.
Accumulation at the 200-week average has resolved higher in every cycle since 2015
Here's our read of the whole board. A ten-month, 50% drawdown from October's $123,500 print has landed price on the long-cycle mean, and the deepest-pocketed cohorts are treating that level as value. The supply they're absorbing comes from the fund wrappers and one obligated corporate seller. That's not distribution. It reads as re-accumulation, at the same altitude where every prior cycle turned.
What consensus misses is that ETF flows measure the wrapper, not the marginal buyer. The wrapper sold $360 million last week and price didn't make a new low, because the float keeps shrinking into illiquid hands. And once paper selling exhausts itself, volume this thin cuts both ways, since there isn't much resting supply above the range either.
Ranges this mature tend to resolve toward whoever kept buying inside them. On-chain, that side is obvious this month. The whales absorbed a corporate seller, an outflow streak, and a Monday flush, and the floor still held. That's the behavior of a market being accumulated, not abandoned.
The watch list from here:
- A daily close above $66,400, the range ceiling that has rejected price twice since July 21.
- Whether CryptoQuant's whale balances keep climbing through the next test of the floor.
- Exchange balances pushing past 1.35 million BTC, which would turn the Santiment signal from noise into warning.
- Funding rates cooling off the 20-month high without price losing $63,000.
- Strategy's next disclosure, because a third sale would push the STRC overhang into September.
And here is where the thesis breaks: a daily close below the $62,200 range floor while exchange balances keep climbing and whale accumulation flattens. That combination would say the absorption failed and the corrective structure has another leg lower. Until one side gives way, the whales hold the receipts and the tape holds the doubt.
Know your entry, your exit, and where you are wrong on Bitcoin
The whale bid against the ETF outflow is the surface signal. Bitcoin is on the Kunkel Capital watchlist: the full research maps the current wave count to a defined entry zone, an exit target and the exact invalidation level, refreshed on a fixed rotation, with alerts when levels hit. €19.99 first month, then €34.99. Cancel anytime.
Frequently asked questions
Why did Bitcoin bounce back above $64,000 this week?
Price dipped to $62,687 on Monday and closed at $64,506 after whale wallets kept absorbing supply. CryptoQuant counts a net 43,000 BTC of large-holder buying over 60 days, and that bid showed up right at the range floor.
What is Bitcoin's 200-week moving average and why does it matter now?
It's the average weekly price of the past four years, and it currently runs near $64,000. Every prior Bitcoin bear market bottomed at or on that line, so long-cycle buyers treat it as the value zone of the market. Price is sitting right on it this week.
Is Strategy dumping its Bitcoin?
No, the filings read as maintenance rather than a change of heart. The firm sold about 3,300 coins across two August disclosures to fund STRC preferred dividends and buybacks, and it still holds 842,138 BTC. That's an obligation-driven trim after a seven-week buying pause, not a portfolio unwind.
Do rising exchange balances mean the whales are about to sell?
Not on their own. Santiment's 1.332 million BTC reading retraces the summer outflow, but inflows also come from market makers staging inventory. It becomes a warning only if balances keep building while the floor is under attack.
What would break the accumulation read?
A daily close below $62,200 while whale balances flatten and exchange inflows continue. That mix would say the range was distribution rather than accumulation, and the burden of proof would flip back to the bulls. Until then, the floor gets the benefit of the doubt.
Sources: CryptoQuant, Glassnode, Santiment, CoinShares weekly fund flow data, Strategy public disclosures, Yahoo Finance price history.
Last updated: 2026-08-19