Bitcoin tagged $81,265 on Tuesday, August 25, and got rejected within the hour. The level that stopped it was the 50-week moving average near $81,085, the line Bitcoin has not closed above since the May top. Consensus, after a 24% rally in eight days, reads the tape as "the bear market is over." The structure says something narrower: the squeeze phase is over, and the first real supply test since May has just begun.
The setup in 3 lines:
- Bitcoin ran from $62,687 (August 17 low) to $81,265 (August 25 high), a 30% move in eight days. It started the afternoon Treasury Secretary Bessent doubled the bond buyback program.
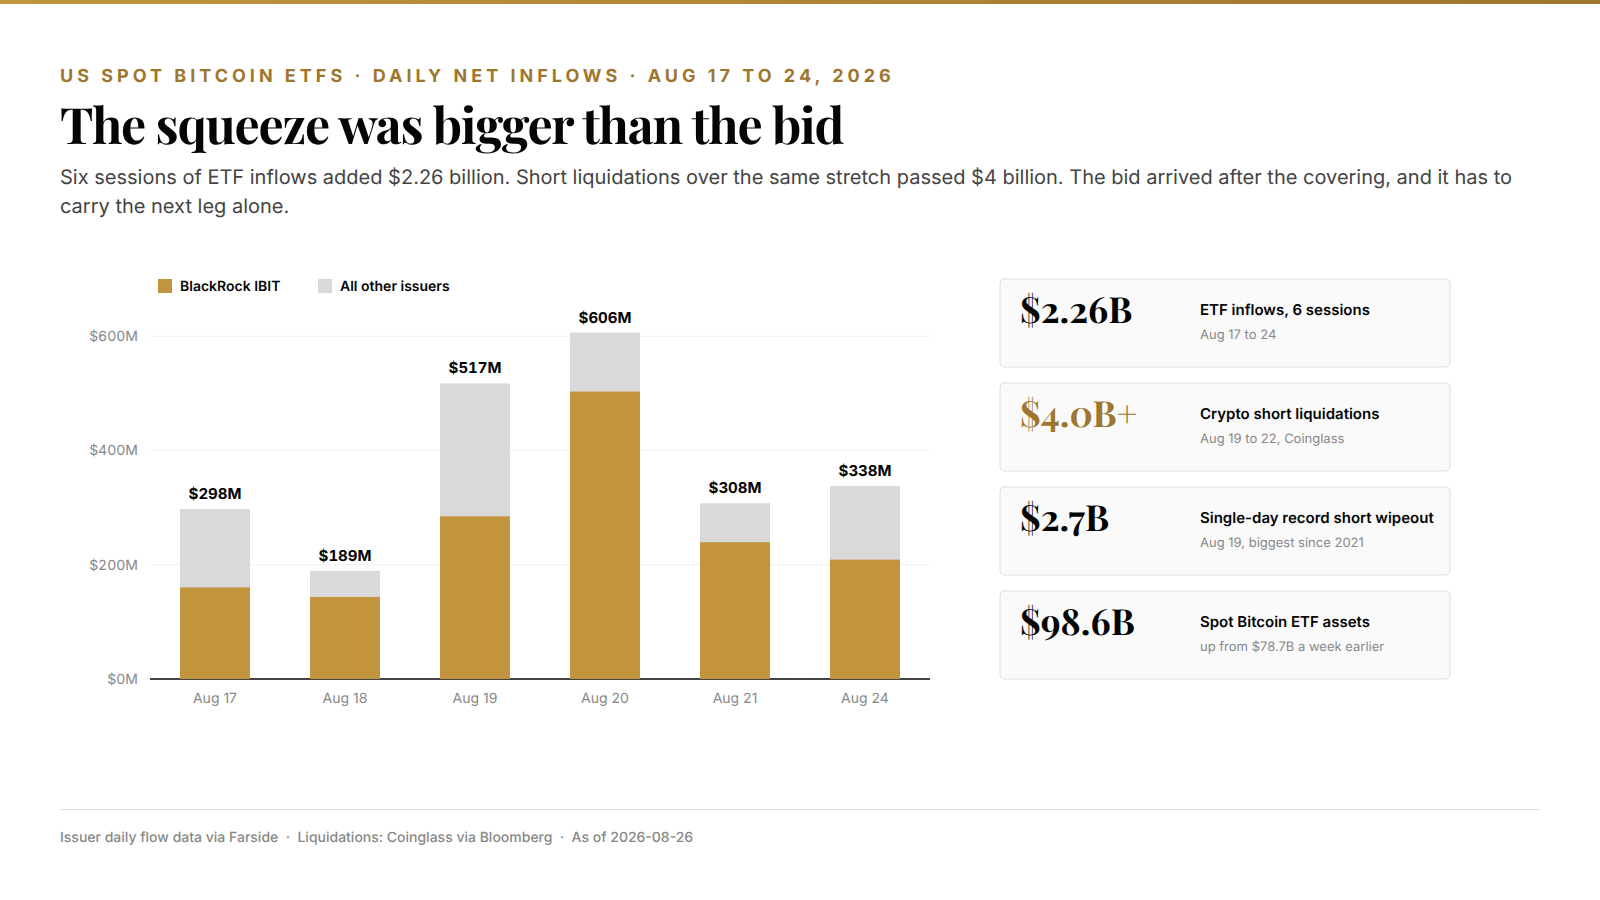
- The move was fuel, not demand: more than $4 billion of crypto shorts got liquidated, while spot ETFs absorbed $2.7 billion in August, the strongest month of 2026.
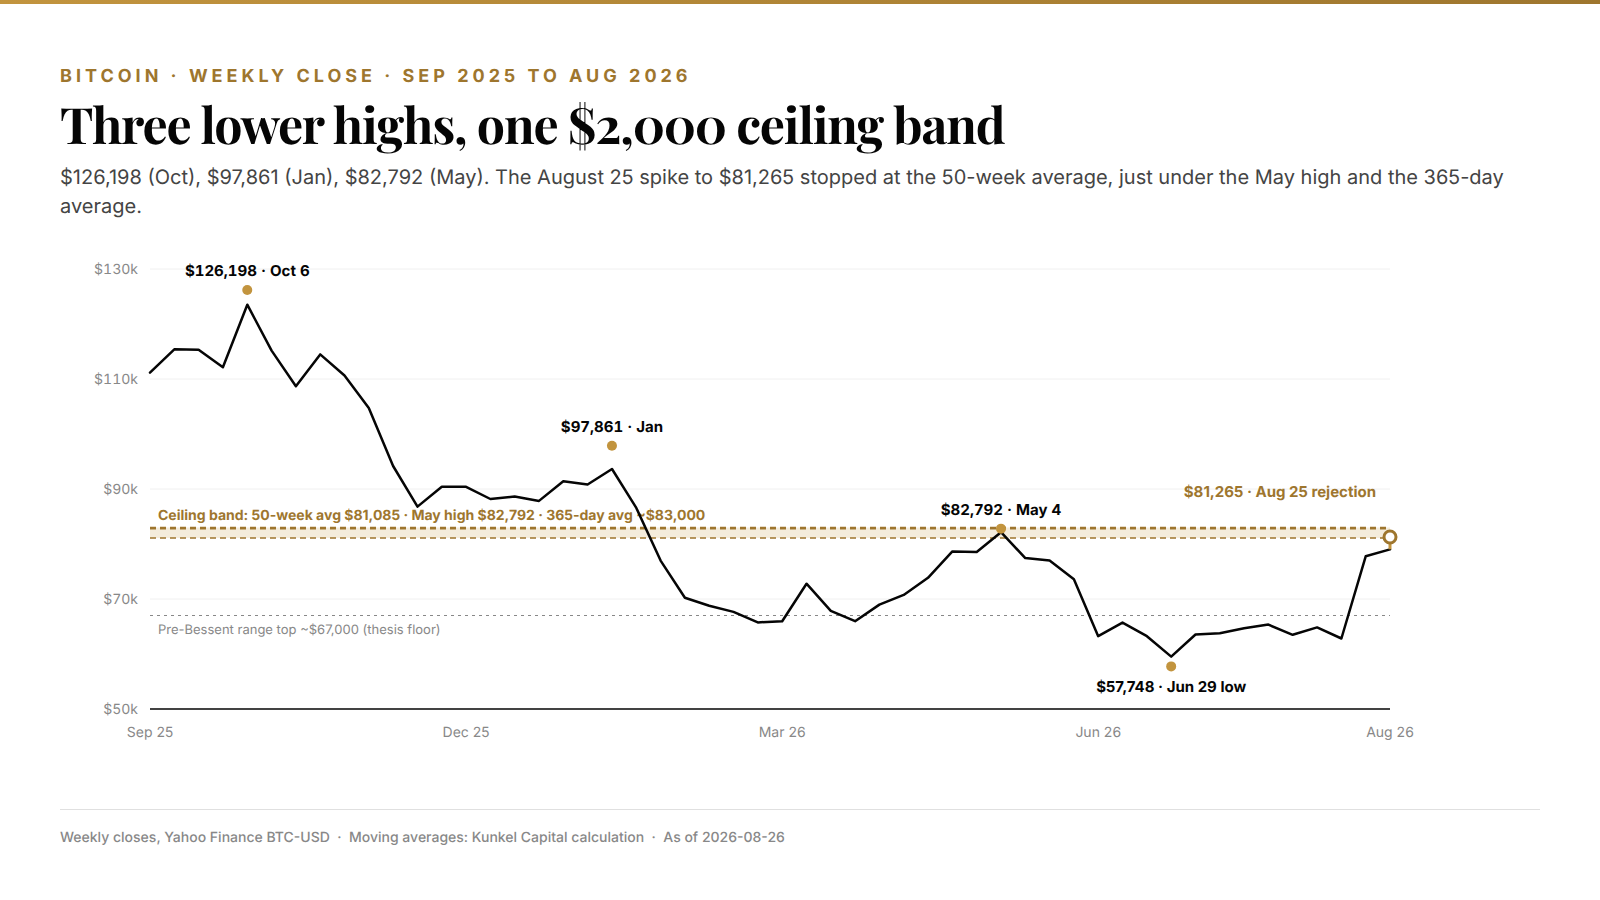
- Three market-visible ceilings now sit inside one $2,000 band: the 50-week average, the May swing high at $82,792, and the 365-day average near $83,000. That band decides whether this is a bounce or a trend change.
Here is the scene that started it. On Wednesday, August 19, at the Treasury's afternoon release, Scott Bessent raised the per-operation cap on 10-, 20- and 30-year buybacks from $2 billion to at least $4 billion. Long yields dropped hard on the headline. Bitcoin, which had spent five weeks pinned between $62,000 and $67,000, ripped through $70,000 before the New York close. More than $1 billion of Bitcoin shorts got liquidated in about an hour, per Coinglass. That is a positioning signal, not a demand signal, and the difference matters for everything that follows.
Bessent's $4 billion buyback lit a $4 billion short squeeze
The buyback was aimed at the bond market, but the bond market shrugged it off within days. Ten- and thirty-year yields dipped on the announcement and then drifted back. By the following Monday the rates desks had labeled the intervention a failure. Bitcoin did not care about that verdict. Crypto shorts had spent July and early August leaning on the $67,000 range top. Once that level gave way, there was nobody left to sell.
The numbers describe a squeeze, not a bid. Read them in the order they happened. Bloomberg counted a record $2.7 billion of short liquidations across crypto on August 19 alone, the biggest single-day wipeout in records going back to 2021. By the weekend the cumulative count had passed $4 billion. Because forced buying does not ask about price, the move covered in three sessions what a normal accumulation would take a quarter to build.
And then the squeeze ran out of shorts. That happened by Friday afternoon, August 21. Friday, August 21, printed the weekly high of the first leg at $79,464. Saturday's dip to $76,527 took out more than $475 million of freshly opened longs. In plain terms, the crowd that had been short at $65,000 was now long at $79,000. The market had already begun punishing the late arrivals.
$4 billion liquidated, $2.7 billion bought. The squeeze was bigger than the ETF bid. That ratio is the whole story of the last eight days.
BlackRock's $503 million Thursday is the real demand print
The squeeze explains the speed, but it does not explain why price held. For that you have to look at the spot ETF tape. It flipped from the weakest month on record in June to the strongest month of the year in August. Six straight sessions of inflows from August 17 through August 24 added roughly $2.26 billion, and Tuesday made it seven.
The single biggest print came on Thursday, August 20, when BlackRock's IBIT alone took in $503 million and the category pulled $606 million. IBIT now holds $59 billion and captures about three-quarters of every dollar that enters the complex. So the marginal buyer of Bitcoin this week has a name, a ticker and a 0.25% fee. That buyer showed up after the squeeze, not before it.
Stablecoin supply confirms the same order of events. Tether minted $2.2 billion and Circle $1.8 billion over the same week. That is the pattern we flagged in how stablecoin mints front-run Bitcoin demand: dry powder gets created first, then it gets deployed. The ETF flow is the deployment step. Translation: the first leg was shorts covering, the second leg was real money, and the second leg is the one that has to carry price through the ceiling.
Three ceilings in a $2,000 band explain Tuesday's rejection
Now for the part consensus is skipping over entirely. The 50-week moving average that capped Tuesday's spike is not sitting alone. The May 4 weekly high at $82,792, the last swing high before the June collapse, sits $1,700 above it. The 365-day average, the line that has separated bull from bear regimes in every prior cycle, sits near $83,000. Any free chart shows all three of them.
That is a wall of visible supply stacked inside one band. The first touch of a wall like that almost never goes through. Every holder who bought the May top is now near break-even. Every trend follower who uses the yearly average as a regime filter is still flat. And every short who survived the squeeze has a defined place to re-enter. Because those three groups all act at the same price, the rejection on Tuesday was the expected outcome, not a surprise.
Wait, actually, the rejection is the healthy version. A market that slices through a band like that on the first attempt is usually still squeezing, and squeezes reverse. A market that gets turned back, rebuilds a base and returns is doing the work a trend change needs. The question for the next two weeks is what the pullback from $81,265 looks like, not whether there is one.
Four things the band tells you, in order:
- The 50-week average near $81,085 is the first line: Bitcoin has not held a weekly close above it since the week of May 11.
- The May high at $82,792 is the last lower high in a sequence that runs $126,198 (October), $97,861 (January), $82,792 (May). A weekly close above it breaks that sequence for the first time in ten months.
- The 365-day average near $83,000 is the regime filter most systematic desks use. Above it, trend models flip long. Below it, they stay flat.
- The pre-Bessent range top around $67,000 is the floor of this entire move. It is where the shorts were leaning, and it is where the thesis gets tested from below.
Bitcoin's bounce has recovered under half of the October-to-June drawdown
Step back to the weekly chart. The shape is plain enough from that distance. Bitcoin topped at $126,198 on October 6, 2025, and bottomed at $57,748 in the week of June 29, 2026, a 54% decline over nine months. The bounce to $81,265 has recovered about a third of that range. Measured against a nine-month bear market, that is not much. Eight days of squeeze do not resolve anything by themselves.
What the structure did resolve is the floor. We mapped the $60,000 area through the whole first half. First the $60,000 floor held a hawkish Fed, then the June ETF exodus broke it, and finally four issuers turned buyers below $64,000. The low at $57,748 came with perpetual funding inverted and realized price acting as the anchor. That is the same fingerprint every prior cycle bottom left behind. So the June low reads as a completed decline, and the August move is the first impulse off it.
Even so, a first impulse is not a confirmed trend. It has to be followed by a pullback that holds above the origin of the move. Then it needs a second leg that clears the ceiling the first leg failed at. Think of it like a spring. The squeeze compressed the sellers and the release sent price up in a straight line. Now the spring has to settle at a higher rest point before it can be loaded again. Where it settles is the read.
Bitcoin is one of the assets on the Kunkel Capital rotation, so members get the full structure map with entry, exit and invalidation refreshed on a fixed cycle.
The pullback from $81,265 decides bounce versus trend change
So here is the resolved read, as of August 26. It comes in three parts, direction first. The direction for the coming quarter is higher, and the mechanism is the hand-off from squeeze to spot demand. The squeeze is finished, the ETF bid is running at a 2026 record, and stablecoin supply says more of that bid is queued. What consensus misses is the order of operations: a rally that begins with $4 billion of forced covering has to prove it can hold without the covering. Tuesday was the first day it had to.
The confirmation is a weekly close above the May high at $82,792. That single print breaks the ten-month sequence of lower highs and puts price above all three ceilings at once. That is why it matters more than any intraday spike through $81,000. Until it happens, the working assumption is a consolidation between the pre-Bessent range top and the 50-week average. The depth of that consolidation is the information.
And here is where the thesis breaks. A weekly close back below the old range top near $67,000 while spot ETF flows flip back to net outflows kills the read. It would mean the squeeze reversed in full and the new money that followed it has left. That is the condition, phrased as behavior on a chart anyone can see. The exact invalidation level from our wave count is a different thing, and it lives in the member research. One acknowledged uncertainty: the 30-year yield is back near where it was before the buyback. If the term premium story reasserts itself, Bitcoin's correlation with duration could flip the sign on this whole sequence faster than the chart suggests.
Ten months of lower highs. $126,198, then $97,861, then $82,792. The next weekly close above the last one is the only print that ends the bear market.
Ethereum's 30% week is the higher-beta version of the same test
Ether ran from $1,874 on August 16 to $2,515 on August 21, a 34% move in five sessions. It has since stalled near $2,460. Spot ETH funds pulled $697 million over the week of August 17, and BlackRock's ETHA took 78% of it. That is the same concentration pattern as IBIT on the Bitcoin side. The daily RSI printed 80 on the spike, the most overbought reading since the July 21 reclaim of $1,900.
For members watching both, the read runs in parallel. ETH is testing the top of its own multi-month range and needs the same hand-off from squeeze to spot demand. But it moves at roughly 1.4 times Bitcoin's beta in both directions. If you want the earliest signal on whether the crypto rally survives the ceiling, watch ETH. It will show the failure first too.
Frequently asked questions
Why did Bitcoin get rejected at $81,000 on August 25? Bitcoin's 50-week moving average sat near $81,085 on Tuesday, and the May 4 weekly high at $82,792 sits just above it. The first touch of a multi-level supply band after a 30% squeeze rally is a normal place for sellers to show up. The pullback to $78,800 was the expected first reaction.
Is the Bitcoin bear market over? Not yet on the weekly structure. Bitcoin still prints a sequence of lower highs from October ($126,198) through January ($97,861) to May ($82,792). A weekly close above $82,792 breaks that sequence and would be the first structural confirmation of a trend change.
What caused the Bitcoin rally in August 2026? On August 19, Treasury Secretary Bessent doubled the per-operation cap on long-dated bond buybacks to at least $4 billion. Long yields fell, Bitcoin broke a five-week range at $67,000, and a record $2.7 billion of crypto shorts got liquidated that day. Spot ETF inflows of $2.7 billion in August then carried price higher after the squeeze faded.
Where does the bullish Bitcoin thesis fail? A weekly close back below the pre-rally range top near $67,000 while spot ETF flows turn negative is the failure condition. It would mean the squeeze fully reversed and the follow-on demand left. That condition invalidates the trend-change read. The exact wave-count invalidation level is part of the Kunkel Capital member research.
Know your entry, your exit, and where you are wrong on Bitcoin
The $81,265 rejection at the 50-week average is the surface signal. Bitcoin is on the Kunkel Capital watchlist: the full research maps the current wave count off the June low to a defined entry zone, an exit target and the exact invalidation level. Levels get refreshed on a fixed rotation, with alerts when they hit. €19.99 first month, then €34.99. Cancel anytime.
Sources: Bloomberg (August 19 and 25 market reports), Coinglass liquidation data, US Treasury buyback announcement of August 19, 2026, spot ETF issuer flow data via Farside, Yahoo Finance weekly OHLC.
Last updated: 2026-08-26