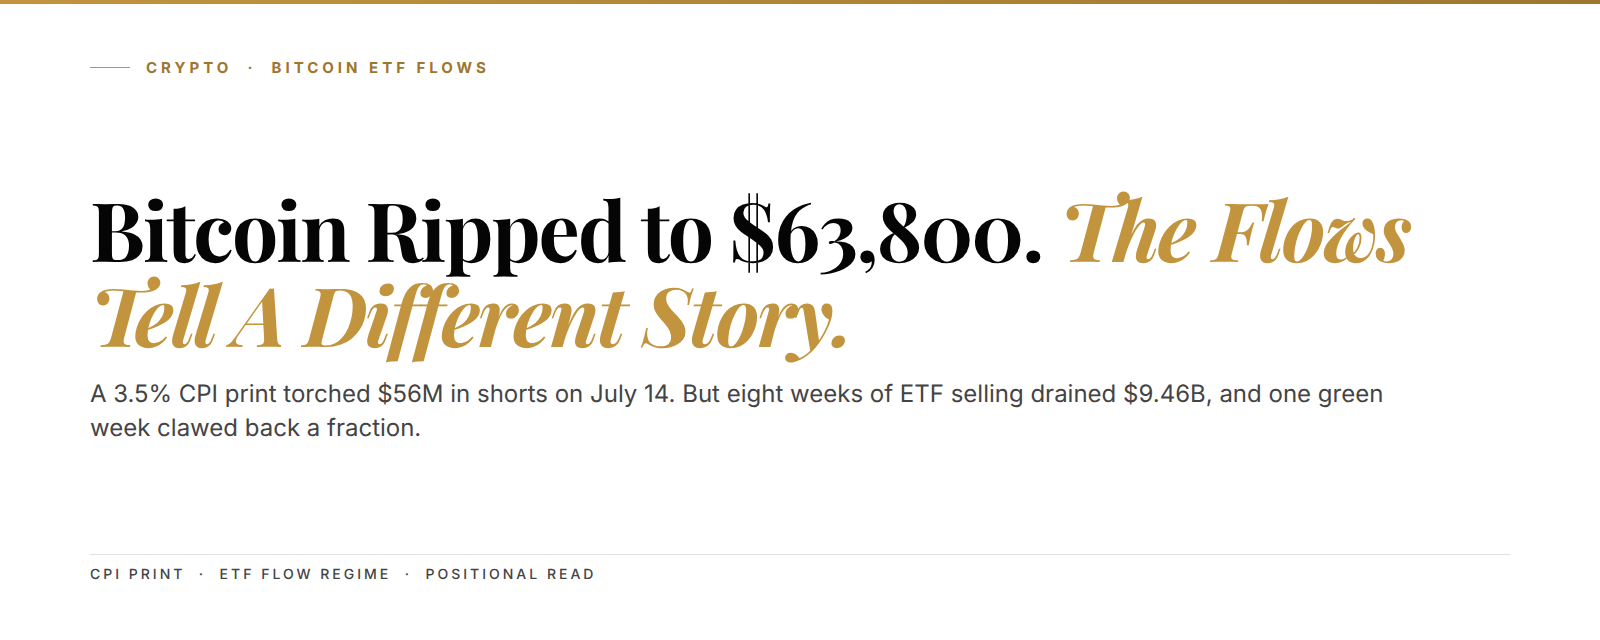
Bitcoin ripped to $63,800 within 30 minutes of Tuesday's June CPI print, torching $56.27 million in short bets in a single hour. The consensus said inflation would stay sticky and keep the Fed boxed in. June's 3.5% headline read blew that up.
Here's the setup. Bitcoin opened Tuesday, July 14, near $62,900 after spending eight weeks bleeding out through the ETF window. The June inflation report hit at 8:30 a.m. Eastern and printed 3.5% year over year, well under the 3.8% the street penciled. Traders repriced Fed policy on the spot, and Bitcoin added roughly $28 billion in market cap before lunch.
But the price candle isn't the real story. The flow regime underneath it is.
Zoom out first. Bitcoin trades near $63,000 today, down roughly 50% from its $126,000 record set October 6, 2025, and eight weeks of ETF selling did most of that damage. So a soft CPI print, one green flow week, and a $424.7 million reversal all land on a chart that's already been cut in half. Context sets the stakes here.
The setup in 3 lines:
- June CPI hit 3.5% YoY versus 3.8% expected, and Bitcoin jumped 2.24% to $63,800 while $56.27M in shorts got liquidated.
- The prior week snapped an 8-week, $9.46 billion ETF outflow streak with $281.8M of fresh inflows, then July 13 gave back $424.7M in one day.
- The tell isn't the CPI candle. It's whether daily ETF flows hold green above a $64,000 reclaim, or the $60,000 floor gets retested.
Now the part most traders skipped. On Monday, July 13, one day before the rip, US spot Bitcoin ETFs shed $424.7 million and wiped out the entire prior week's inflow in a single session. The recovery failed its first real test, and then CPI landed and price ran anyway. That gap between flow and price is the whole trade.
June's 3.5% CPI print did what eight weeks of ETF flows couldn't
The June report surprised on every line. Headline CPI came in at 3.5% year over year against the 3.8% the street had penciled, and core CPI, which strips out food and energy, printed 2.6% versus forecasts near 2.8%. Prices actually fell 0.4% month over month, the sharpest monthly drop since May 2020.
Rate markets moved fast. CME FedWatch, the tool that reads hike odds off Fed funds futures, had shown a July hike near 28.9% earlier in the cycle, and soft data crushed that number. By Tuesday, traders were pricing cuts, not hikes.
Translation: cheaper money is coming sooner than the market thought last week. Risk assets love that, and Bitcoin is the highest-beta risk asset there is.
The reaction was textbook. Bitcoin climbed from $62,900 to nearly $63,800 inside half an hour, Ethereum did better at up 4.88% to $1,880, and crypto tacked on tens of billions in an hour. You've seen this movie: a soft print, a fast squeeze, a green candle everyone screenshots.

$56.27 million. That's the short interest Bitcoin torched in 60 minutes. Long liquidations came to $3.94 million, so the move ran one-directional, which tells you it was fuel, not demand.
The 8-week outflow streak drained $9.46 billion before it snapped
Back up eight weeks. US spot Bitcoin ETFs bled for eight straight weeks into early July, the longest redemption streak since the funds launched. The drain totaled $8.26 billion from Bitcoin products and another $1.20 billion from Ether funds, call it $9.46 billion combined.
Then it stopped. The week of July 7 to July 11 pulled $281.8 million in net inflows, with Bitcoin funds taking $197.4 million and Ether funds adding $84.4 million. It was the first green week since the one that ended May 8, back when the funds drew $622.7 million.

Translation: for two months institutions were sellers, and for one week they turned buyers. That's a regime question, not a headline.
Context matters here, because both products are still deep in the red for 2026. Bitcoin funds are down $5.34 billion year to date and Ether funds are off $1.35 billion, so one good week doesn't erase two bad months. We mapped that same tension in Bitcoin's $406B ETF exodus and the $60,000 floor, and the capitulation-low bid return is the pattern to watch now.
$9.46 billion. That's what redeemed from both products across the eight-week streak. One green week clawed back just $281.8 million of it, so the gap is the point.
BlackRock's IBIT pulled $291.9 million, then July 13 gave $424.7 million back
BlackRock ran the tape. Its IBIT fund, the largest spot Bitcoin ETF on the market, pulled $291.9 million between July 6 and July 10, and that single fund out-earned the entire industry's net weekly gain. When IBIT leads a session, the desk reads it as real re-entry, not tourist dip-buying.
Then July 13 happened. Spot Bitcoin ETFs coughed up $424.7 million in one session, and the prior week's $197.4 million inflow vanished as July flipped red overnight.
Wait. Read that again. The recovery snapped an eight-week streak, then failed its very first follow-through test 48 hours later. That's not a clean bottom. That's a fight.
Bitcoin's ETF net assets still sit at $77.42 billion, against $51.28 billion of cumulative net inflows since launch. The base is huge, but the marginal flow is what moves price, and the marginal flow just went choppy. This is the same dynamic we broke down in ETF flows drive price discovery.
The $56 million short liquidation says positioning, not conviction, drove the rip
Positioning drove Tuesday's move, not fresh demand, and here's how you know. Of the $60.21 million liquidated across crypto in the first hour, shorts accounted for $56.27 million while longs lost just $3.94 million. A balanced market bleeds both sides, but this one only bled bears.
Think of a crowded elevator where everyone leaned against one wall. The CPI print tilted the floor, and everyone slid the same way at once. That slide is the squeeze, not the trend, and it isn't a floor either.
Translation: the rip was short covering, not accumulation. Short covering burns hot and fast, and it doesn't build a base by itself.
That's the entire game right now. The same funding-driven flush shows up in perpetual funding at capitulation lows, where forced selling and forced buying both spike near the turn.
Ethereum's 4.88% pop and $84.4 million inflow rode Bitcoin's coattails
Ethereum outran Bitcoin on the print, jumping 4.88% to $1,880 while Bitcoin managed 2.24%. That higher beta is normal, because when rate-cut bets rise the riskier coin runs harder, and Ether added roughly $10.8 billion in market cap on the move.
The flow picture rhymes. Ether ETFs took $84.4 million of the $281.8 million weekly total, and net assets across those funds sit at $9.59 billion, a fraction of Bitcoin's $77.42 billion base. Smaller base, sharper swings.
Translation: Ethereum gives you a louder version of the same signal, rallying faster on good news and bleeding faster on bad. The Bitcoin correlation regime flip is why the two still move together when macro does the driving.
Bitcoin's real tell sits in the flow regime, not the CPI candle
Watch the flows, not the candle. Price gave you a 2.24% pop, which is nice, but it's noise until the ETF prints confirm it. The real signal is whether daily net inflows hold green in the sessions right after CPI.
If BlackRock and the rest keep bidding through the back half of July, the one green week becomes a trend and capitulation turns into accumulation. That's the multi-quarter setup our research has tracked since the $60,000 zone first held, and the realized-price cycle-bottom work frames where the durable buyers sit.
If July 13's $424.7 million outflow was the honest print, the CPI rip fades and Bitcoin slides back toward the floor. The $60,000 shelf gets tested for real this time.
You don't have to guess. You have to watch the flow tape daily and size for both outcomes.
Five numbers that frame the Bitcoin setup right now
- 3.5%: June headline CPI, versus the 3.8% the street expected.
- $56.27M: short liquidations in the first hour, against $3.94M in longs.
- $281.8M: the one-week ETF inflow that snapped the 8-week streak.
- $424.7M: the July 13 single-day outflow that gave the week back.
- $60,000: the floor that held through eight weeks of redemptions.
- $9.46B: total drained across both products during the 8-week bleed.
The positional read: $64,000 reclaim or the $60,000 floor gets retested
The line in the sand is $64,000, and Bitcoin needs to reclaim it on a daily close. Above there, the squeeze has room to extend toward the $66,000 to $68,000 pocket, where the last heavy supply sits.
Below $62,000 the bid gets thin fast, and the $60,000 floor becomes the whole ballgame. It held through eight weeks of outflows and the June bleed, so losing it on rising ETF redemptions is the trigger that flips the structural picture. The shrinking illiquid float is what makes that floor matter more than the headlines.
Our read, as of July 15, 2026: the CPI print bought Bitcoin time, not a trend, and the flow regime decides the next leg. We're watching the daily ETF tape for three straight green sessions as the confirmation trigger.
We could be wrong on timing. If the Fed-cut repricing runs harder than the flows, the reclaim comes before the tape confirms it, and that's the honest uncertainty in this one. You size it small until the flows agree with the price.
See the full Bitcoin CPI-and-flow setup
The $63,800 CPI rip and the snapped 8-week outflow streak are the surface signals. The Kunkel Capital research adds the daily ETF flow map, the exact $60,000 to $68,000 zone structure, our three-session confirmation trigger, and a sized entry plan for both the reclaim and the retest. €19.99 first month, then €34.99. Cancel anytime.
Frequently asked questions
Why did Bitcoin jump on the June CPI report?
June CPI printed 3.5% year over year, below the 3.8% forecast, with core at 2.6%. Softer inflation pushed traders to price fewer Fed hikes and earlier cuts, and cheaper money helps risk assets, so Bitcoin ripped from $62,900 to $63,800 while Ethereum rose 4.88%.
What snapped the 8-week ETF outflow streak?
The week of July 7 to July 11 pulled $281.8 million in net inflows across US spot Bitcoin and Ether ETFs. Bitcoin funds took $197.4 million and Ether funds added $84.4 million, the first green week since the one ending May 8.
Is the Bitcoin bottom confirmed now?
No. The streak snapped, then July 13 saw a $424.7 million single-day outflow that erased the prior week's gain, and both products remain in net outflow for 2026. One green week inside a choppy tape is an early signal, not a confirmed bottom.
What level matters most for Bitcoin now?
Two levels matter. A $64,000 daily-close reclaim opens the door toward the $66,000 to $68,000 supply pocket, while the $60,000 floor held through eight weeks of outflows. Lose it on rising ETF redemptions and the structural read changes.
How much did shorts lose on the CPI move?
Crypto saw $60.21 million in liquidations in the first hour, and shorts accounted for $56.27 million against just $3.94 million in longs. That one-sided flush points to short covering rather than fresh buying demand.
Last updated: 2026-07-15