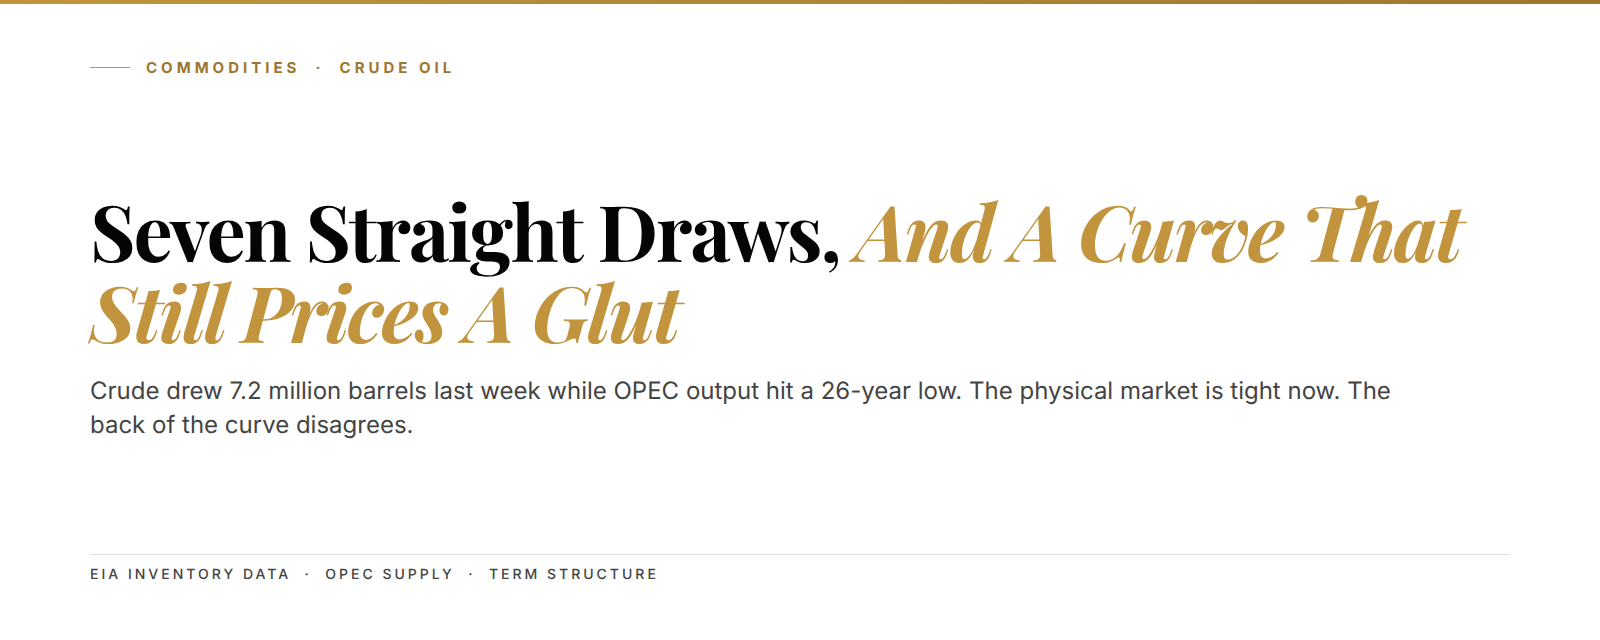
Crude oil drew down 7.2 million barrels last week, the seventh straight weekly draw, and the futures screen still trades like the barrel market is loose. The EIA posted the number Wednesday, June 10. A crude inventory draw means refiners and exporters pulled more oil out of storage than producers and imports put back in. Seven weeks of that is not noise. US commercial crude stocks now sit near 426.5 million barrels, about 5% under the five-year average. WTI changed hands close to $90. The physical market keeps tightening while the back of the curve still prices a glut.
---
The setup in 3 lines:
- US crude stocks fell 7.2 million barrels for the week ending June 5, the seventh straight draw, down to 426.5 million barrels.
- OPEC pumped just 16.13 million barrels a day in May, the lowest monthly figure since at least 2000, per a Reuters survey.
- The front of the curve screams tight now. The back of the curve, and the Street's late-2026 surplus call, says loose later. That gap is the trade.
Here's the part consensus keeps skipping. When the EIA dropped the number at 10:30 Wednesday morning, front-month WTI was already bid, up more than 2% on the session toward $91. That print was the seventh weekly draw in a row. Tank farms don't drain for seven straight weeks in a market that's actually oversupplied.
So the question isn't whether crude is tight today. It's tight. The question is how long the screen can keep pricing a glut that the tank farms can't find.
Crude drew 7.2 million barrels last week, and that's seven in a row
Seven straight weekly draws is the signal, not the headline price. The EIA's weekly report (the US government's Wednesday snapshot of oil in storage) showed commercial crude down 7.2 million barrels for the week ending June 5. The Street looked for a draw near 4 million. The real number nearly doubled it.
Stocks now sit at 426.5 million barrels. That's roughly 5% below the five-year average for this time of year. The cushion is thinning, week after week.

7.2 million barrels. That's the draw nobody on the equity desk priced, the seventh week running.
Think of it like a reservoir in a drought. Rain isn't coming in. The town keeps drinking. The water line drops a little every week, and after seven weeks you stop calling it weather.
Translation: producers and imports aren't keeping up with what refiners pull. That's what a draw is. Seven of them say the barrel market is short right now, not next quarter.
Refineries are the reason the draw is this steep. They ran at 17.0 million barrels a day last week, near 95.3% of capacity. When plants run that hot, they eat crude fast. We read the early-May dip as routine maintenance season noise at first. It wasn't.
OPEC pumped 16.13 million barrels a day in May, the lowest since 2000
OPEC's May output collapsed to a level the market hasn't seen this century. A Reuters survey of the 11-member group put production at 16.13 million barrels a day. That's down 1.06 million barrels a day from April. It's the lowest monthly figure since at least 2000, below even the 2020 pandemic floor when demand fell off a cliff.
Iran took the biggest hit. The US naval blockade that started April 13 cut Iranian crude and condensate exports to a six-year low. Iran's effective closure of the Strait of Hormuz, the chokepoint that moves a fifth of the world's seaborne oil, squeezed exports from other Gulf producers too.
1.06 million barrels a day. That's how much OPEC supply vanished month-over-month in May.
Translation: the world's biggest swing producers are pumping less than at any point in twenty-six years. Less oil leaving the Gulf means fewer cargoes landing at US and Asian ports. That feeds straight back into the draws.
Put the two numbers next to each other. Supply into the system is at a multi-decade low. Stocks are draining 7 million barrels a week. You don't need a model to see which way that pushes the prompt barrel.
The back of the curve still prices a glut the tank farms can't find
Consensus is leaning on a late-2026 surplus that hasn't shown up yet. J.P. Morgan's commodity desk has flagged Brent averaging near $60 later this year on expected oversupply. The far end of the futures curve agrees, pricing later-dated barrels well below the front.
Here's the tension. The EIA itself models Brent near $105 through July under a closed-Strait scenario. So one part of the same agency sees triple digits this summer, while the back of the curve and the bank desks price a glut into the winter.
Both can't be the trade. The front of the curve is anchored in barrels that exist, in tanks you can measure. The back is anchored in a forecast.
We've seen this split before. In late 2021, the physical market screamed tight for months while the back of the curve kept pricing normalization. The front won. Backwardation, the market state where the front contract trades above later months, held far longer than the surplus crowd expected. We mapped that exact regime in our Brent term-structure breakdown.
$105 vs $60. The same barrel, priced two ways. The summer print and the winter forecast can't both be right.
Translation: the screen is pricing relief that depends on Hormuz reopening and OPEC restoring barrels. Until that actually happens, the tanks keep draining. The forecast is a bet. The draw is a receipt.
Refineries ran at 95.3% while the Strait of Hormuz stayed shut
Demand isn't soft, and that's the piece the surplus call underweights. US refinery utilization (the share of plant capacity actually running) sat at 95.3% last week. Plants don't run that hot into weak product demand. They run hot because gasoline and diesel margins pay them to.
Now layer the supply side on top. OPEC at a 26-year low. Iranian barrels blocked. Hormuz throttled. The IEA has tracked this kind of squeeze before in its monthly Oil Market Report, and the pattern rhymes: when the chokepoint tightens, the draw accelerates.
This is where spare capacity matters. The buffer of idle production that OPEC can switch on has been shrinking for two years. We walked through that erosion in our spare-capacity breakdown. Thin buffer plus blocked exports plus hot refineries is the recipe for a draw streak.
You can see why the prompt barrel keeps getting bid. Somebody short physical crude has to find a cargo. Right now the cargoes are scarce.
Trading houses are paying up for prompt cargoes, not later ones
The clearest tell sits in who's bidding for what. Physical desks like Vitol and Trafigura, the two largest independent oil traders on the planet, make their money on the spread between barrels now and barrels later. When they pay a premium for prompt cargoes, the market is short. That's exactly what the curve shape says today.
Picture the desk at 7 a.m. A refiner on the US Gulf coast needs a cargo this week, not in October. The plant is running at 95% and the tanks are low. So the desk lifts the prompt barrel and pays up. Multiply that by every short refiner in the system.
Front bid over back. That's the whole story in two words. Prompt barrels are the ones getting fought over.
Translation: nobody fights this hard for a barrel they can get cheaper next month. The premium on prompt crude is the physical market telling you it's tight, in cash, today. The screen's later-dated discount is a forecast nobody has to honor yet.
This is the same backwardation logic that ran for months in 2021 and 2022. The front held bid long after the surplus crowd called the top. If you're tracking the curve, the prompt premium is the number to watch first.
Five things the seven-week draw is telling you
The draw isn't one signal. It's five, stacked.

- Physical tightness is real now. Seven straight weekly draws and stocks 5% under the five-year average is a present-tense fact, not a forecast.
- Supply is structurally short. OPEC at 16.13 million barrels a day is the lowest since 2000, and the Iran blockade has no published end date.
- Demand is firm. Refineries running 95.3% don't signal a consumer that's pulling back.
- The curve is split. Front-month strength against a back-end surplus bet is the cleanest divergence in the complex.
- The risk is binary. Hormuz reopening or a fast OPEC restore is the one thing that rebuilds the cushion quickly.
Translation: four of the five point the same direction. Tight. The fifth is the headline risk you have to respect.
What flips crude back to surplus, and the level we're watching
The bullish case has one real off-switch, and you have to name it honestly. If Iran reopens the Strait of Hormuz and the blockade lifts, Gulf barrels flood back. The 1.06 million a day that vanished in May could return in weeks. The cushion rebuilds. The draw streak ends.
We could be wrong on the timing here. Geopolitics doesn't trade on a schedule, and a single headline can reprice the front by $5 in an hour. That's the uncertainty we carry into the position.
But until that switch flips, the math favors the front. Stocks below the five-year average, supply at a 26-year low, refineries near full tilt. The structural read stays tight while crude holds above the level where the seven-week draw began. The exact invalidation, and the wave count we're tracking off the spring low, is where this gets specific.
For traders watching the broader complex, the same physical-tightness logic spilled into natural gas this spring. We mapped that shoulder-season setup here. And on the positioning side, commercial hedgers have been quietly net-long the energy complex, a pattern we tracked in our COT breakdown.
As of June 11, 2026, the front of the curve and the tank-farm data are on the same side. The back of the curve and the bank desks are on the other. We know which side has the barrels.
See the full crude tightness setup
The seven-week draw and the OPEC supply collapse are the surface signal. The Kunkel Capital research adds the exact backwardation thresholds we track on WTI and Brent. It maps the wave count off the spring low, the invalidation level where the tight read breaks, and the producer equities (XOM, OXY, EQNR) most geared to the curve regime. Entry, stop, target, sizing. €19.99 first month, then €34.99. Cancel anytime.
Frequently asked questions about the crude inventory draw
What is a crude oil inventory draw?
A crude oil inventory draw happens when refiners and exporters pull more oil out of storage than producers and imports add back in. It's a sign the barrel market is tight. The EIA reports US crude stocks every Wednesday.
How big was the latest draw?
US commercial crude stocks fell 7.2 million barrels for the week ending June 5, 2026, the seventh straight weekly draw. Stocks dropped to 426.5 million barrels, about 5% below the five-year average. The market had looked for a draw near 4 million.
Why is OPEC output so low right now?
OPEC pumped 16.13 million barrels a day in May 2026, the lowest since at least 2000. The US naval blockade that began April 13 cut Iran's exports to a six-year low, and Iran's throttling of the Strait of Hormuz squeezed other Gulf producers.
What would end the tight market?
The fastest off-switch is the Strait of Hormuz reopening and the Iran blockade lifting. That would let Gulf barrels flood back, rebuild storage, and end the draw streak. Until then, low supply and hot refinery runs keep the physical market short.
Last updated: 2026-06-11
Not investment advice. Kunkel Capital Research publishes market-structure analysis for educational purposes. Do your own diligence before trading.