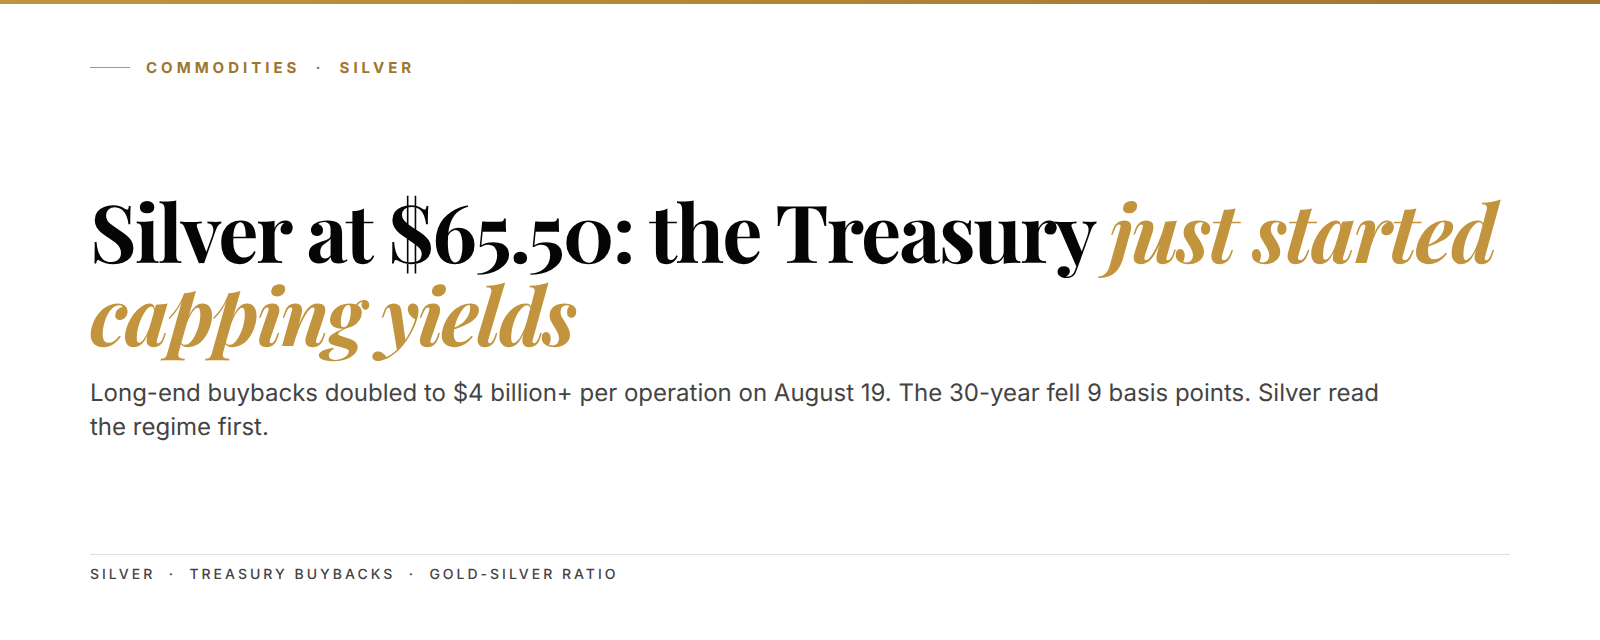
Silver traded up to $65.50 on Wednesday, its highest print in two months, and the push came from an unusual desk. Not from the Fed, and not from a mining headline: from the US Treasury. On August 19 the department said it would double the operations it uses to buy back its own older long-dated bonds. Yields at the long end dropped within the hour. Most desks filed the move as a one-day rates bounce. We read the tape as something bigger: the Treasury has started managing the long end of the yield curve, and silver is the cleanest asset priced off that shift.
The setup in 3 lines:
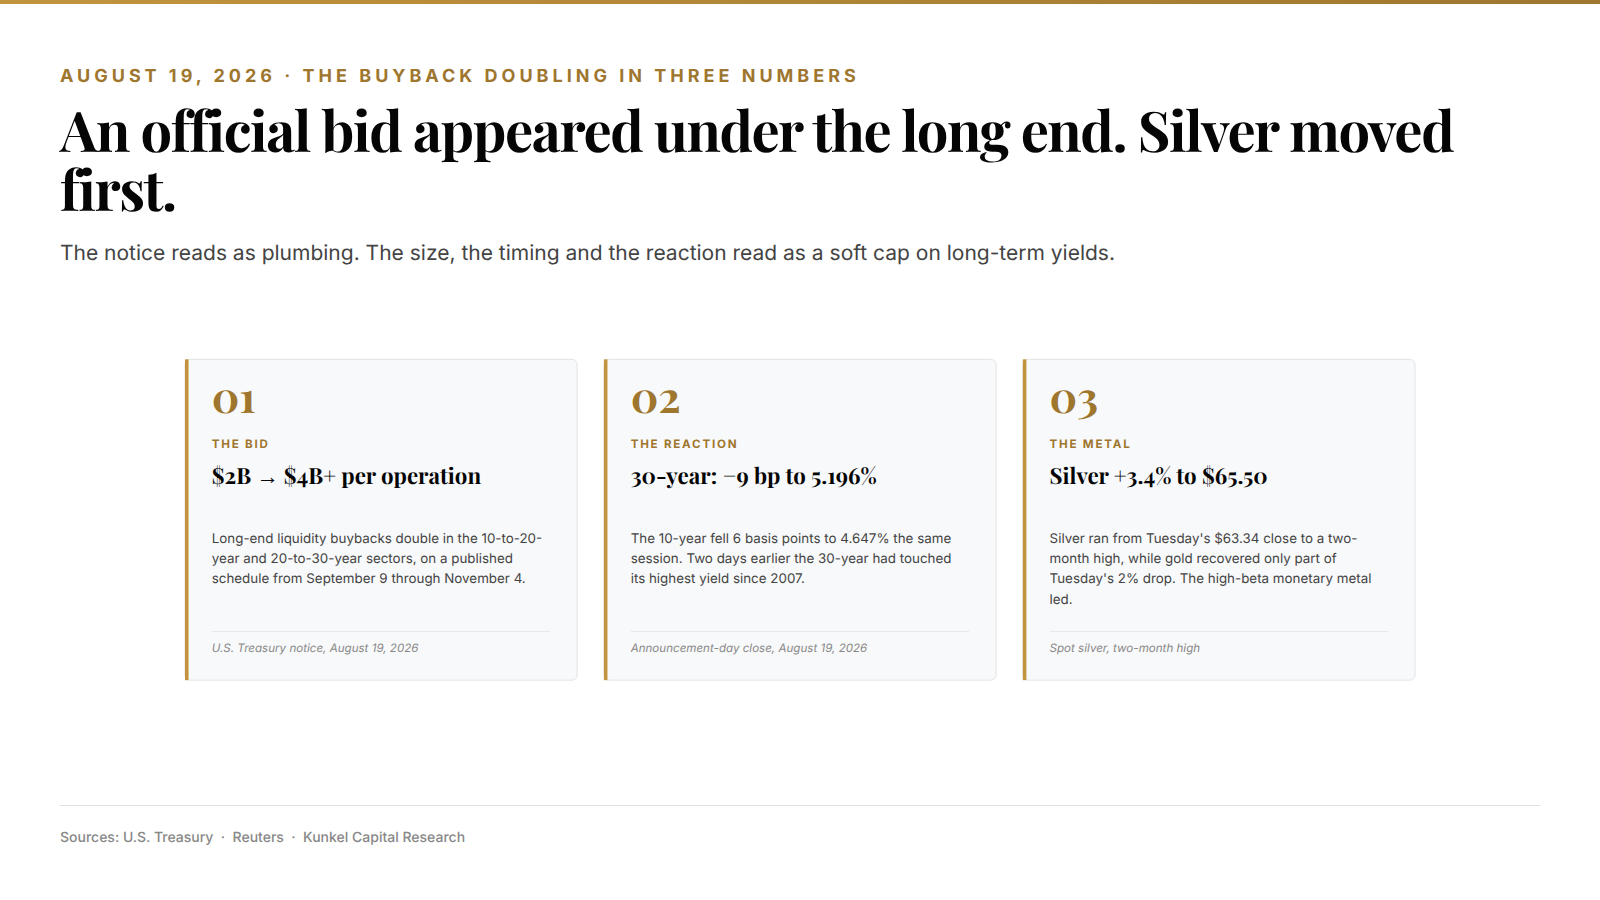
- The Treasury doubled its long-end buybacks to at least $4 billion per operation on August 19, and the 30-year yield fell 9 basis points that same session.
- Capped nominal yields with inflation still sticky means compressed real yields (yields after inflation), the one macro input monetary metals price most directly.
- Silver adds a sixth straight annual supply deficit to that bid, and it just retook leadership from gold with a 14 percent gain in a month.
Here's the moment that matters most this week. On Wednesday afternoon, Scott Bessent's Treasury posted a notice with a sleepy title: increased sizes of nominal long-end liquidity support buybacks. The content was far from sleepy. Buyback operations in the 10-to-20-year and 20-to-30-year sectors double from $2 billion to at least $4 billion each, running from September 9 through November 4. Just two days earlier, the 30-year yield had touched its highest level since 2007. Nobody at the department connected those dots out loud. The bond market connected them within minutes.
Treasury's $4 billion buyback doubling is yield management wearing a liquidity badge
Start with what a buyback operation is, because the mechanics carry the story. The Treasury buys back its own off-the-run bonds (older issues that trade thin) and funds the purchase by selling more of the current, liquid issue. The stated goal is smoother trading, not stimulus. And in normal size that's exactly what it is: a plumbing tool nobody outside the repo market ever talks about.
Wednesday's notice changed the size. At $4 billion or more per operation, across two long-maturity buckets, through early November, the program stops being invisible plumbing and becomes a standing bid under the longest bonds in the market. The 10-year yield fell 6 basis points to 4.647% on the announcement, and the 30-year fell 9 basis points to 5.196%. That's a big single-day move for an operational footnote.
Think of an auctioneer who starts bidding on his own lots whenever the room goes quiet. The catalog still says every item sold at a fair price. But the floor is now the auctioneer's own paddle. Everyone in the room adjusts the moment they notice, and Wednesday's bid got noticed just as fast.
We can't prove intent from a press release, and the liquidity story isn't fake: off-the-run trading really has thinned as issuance grows. Even so, the pattern this year points one way, because the department has already stepped into the yen market and pushed for wider foreign repo backstops at the Fed. Now it doubles its own bid at the long end two days after a 2007-era yield print.
Translation: the world's largest borrower started buying its own debt at the maturities where buyers went missing, and it did so the same week those maturities hit two-decade yield highs.
A 9-basis-point drop in the 30-year moved silver 3.4 percent in a session
Now look at what traded best on the news. Bonds were not the winner on their own announcement. Silver went from Tuesday's $63.34 close to $65.50 at Wednesday's high, a 3.4 percent move against a 9-basis-point yield drop. Gold, for comparison, had dropped about 2 percent on Tuesday as the 10-year pushed toward 4.72%. On Wednesday it clawed back far less than silver added.
That asymmetry is the tell. If Wednesday were just a rates bounce, you would expect gold, the purer rate-sensitive metal, to lead the reaction. Instead the metal with the industrial deficit and the far smaller market led it by a wide margin. Silver behaves like this when the market prices a regime, not a data point. It did the same thing earlier this month, when the first negative payroll print of the hike cycle sent it up 11 percent in a week.
The mechanism runs through real yields, meaning what bonds pay after inflation. Monetary metals pay no coupon, so their main competition is the real return on government paper. When inflation stays sticky while an official buyer caps nominal yields, that real return shrinks from both sides at once. We argued in June that real yields stopped predicting gold on the way up, and the buyback regime is the other half of that story, because now the yield side is being managed too.
$4 billion per operation. The Treasury's long-end buybacks double in size from September 9, two days after the 30-year touched its highest yield since 2007.
The 30-year at a 2007-high yield forced the move, and the Fed can't fix the long end
So why would the Treasury act now? Because the long end has been slipping away from everyone since spring. We covered the shift when the term premium turned positive (the extra yield investors demand for holding long maturities) and again when the 30-year first cleared 5.2 percent. This week the same bond made a new cycle high while the economy underneath it softened.
The softening is what sharpens the corner policy is in. July retail sales fell 0.6 percent against expectations for a small gain, the first decline after nine straight monthly increases. So the consumer is cracking while long-term borrowing costs sit at two-decade highs. The Fed is still fighting inflation from the short end. That leaves the long end with no natural official buyer. Except, as of Wednesday, it has one.
Here is what the notice actually changes, in order of importance:
- A known official bid of at least $4 billion now sits under each long-maturity bucket, on a published schedule, through November 4.
- Shorts at the long end now fight the issuer itself, which changes how hard they can press into auctions.
- Real yields get squeezed from both directions if inflation stays sticky while nominal yields are capped.
- The dollar's yield support at the long end weakens at the margin, which has fed metal bids in past cycles.
- The next escalation step is now visible: if $4 billion doesn't hold the line, the same template scales.
Put simply, the bond market's disciplinarian just met a counterparty with a printing press behind it. Whether you call that yield curve control is semantics. The market will trade the bid, not the label.
Silver's sixth consecutive supply deficit turns a rate trade into a regime trade
Gold responds to the same regime, of course. But silver brings a second engine that gold doesn't have: the physical market keeps running out of metal. The Silver Institute has the market in its sixth consecutive annual supply deficit in 2026. It estimates roughly 762 million ounces have left above-ground stocks since 2021.
The detail that struck us most this year cuts against the obvious bear case. Solar manufacturers, the biggest industrial growth engine of the past decade, cut their silver use by about 19 percent through thrifting (using less metal per panel). That should have closed the deficit. It didn't, because mined supply is shrinking faster than the industrial side is economizing, while demand from data centers and autos keeps building.
762 million ounces. That's the metal the Silver Institute estimates has left above-ground stocks since 2021, six deficit years in a row.
So the regime bid lands on a market that has already spent its buffer. When the same asset gets a monetary reason to be bought and a physical reason not to be sold, moves stop being polite. The past year's 71 percent gain is what that looks like on a chart. Roughly 14 percent of it came in the past month.
Silver is one of the assets on the Kunkel Capital rotation: members get the full structure map with entry, exit and invalidation refreshed on a fixed cycle.
Gold-silver ratio at 68 stopped rising in July, and Wednesday pushed it back down
The gold-silver ratio (how many ounces of silver one ounce of gold buys) is the cleanest lens on Wednesday's move, and its recent history is violent. The ratio hit an extreme near 100 in April 2025, then collapsed into the mid-30s by January as silver went vertical. Silver's summer crash took it all the way back to 69 by mid-July. With gold around $4,350 and silver in the mid-60s, it now sits near 68.
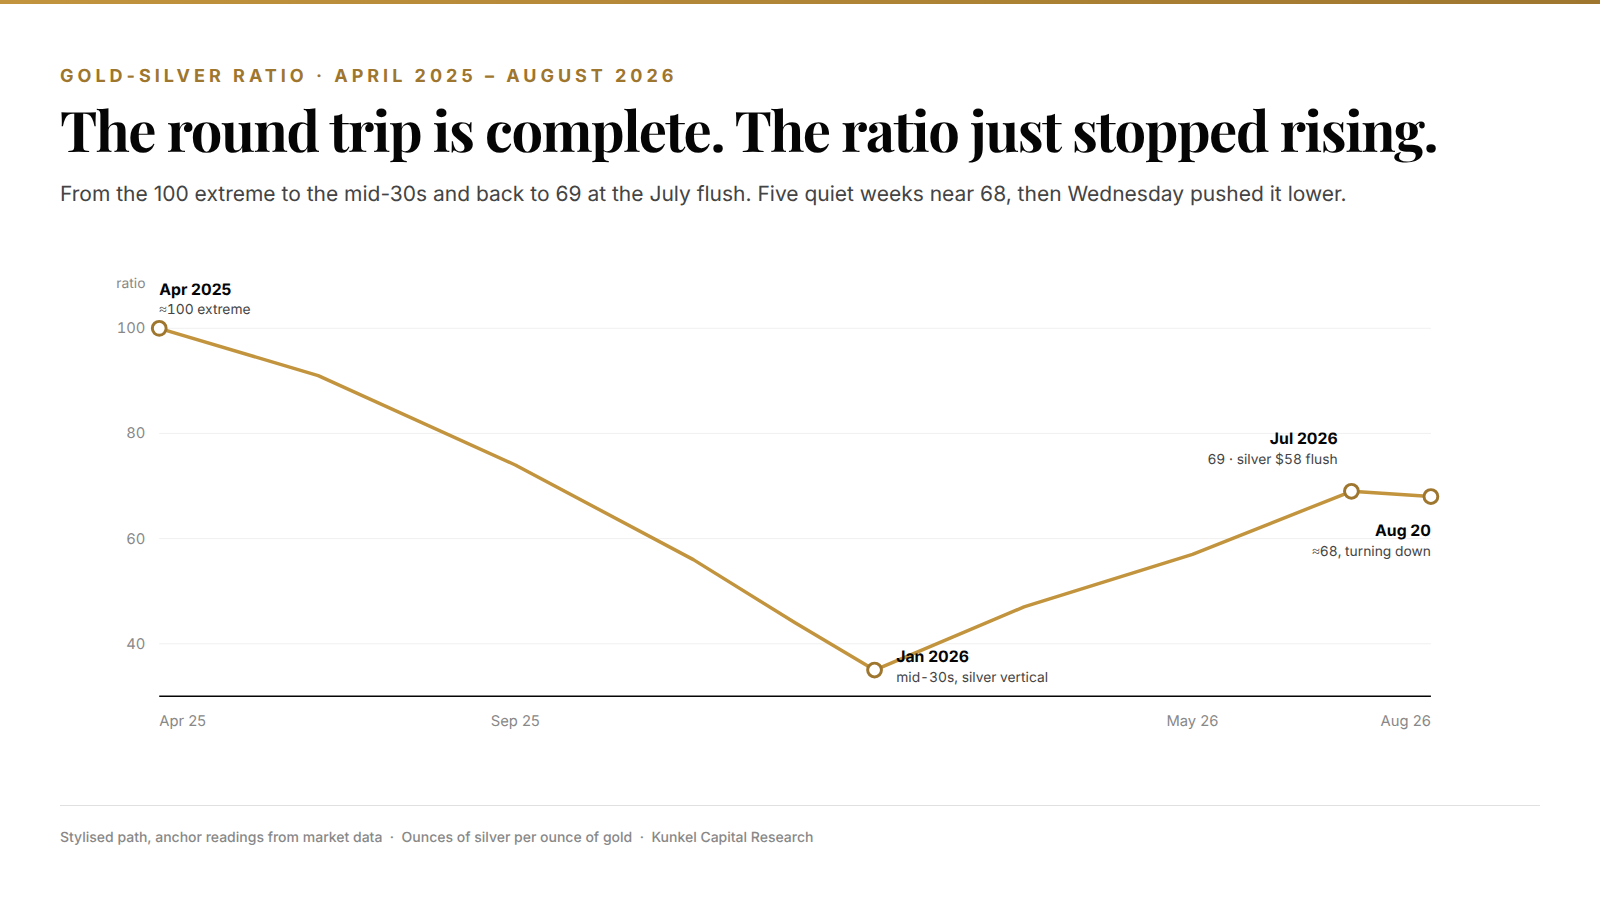
Our own coverage maps that path well. In May we traded the ratio's snap from 60 to 55 and back, and in July we flagged the give-back when silver fell to $58 while gold held $4,000. That flush washed out the crowded longs. Wait, actually, "washed out" undersells it: the daily RSI (a momentum gauge) printed in the low 20s in early August, the kind of reading you see at capitulation lows. Two weeks later the metal was back above $65.
Since the July flush the ratio has gone quiet near the high 60s, and quiet after a violent retracement is information. Gold kept its own bid through August, yet silver stopped losing ground against it. Then on Wednesday the ratio ticked lower again as silver led the metals on the buyback news. In structure terms the summer give-back looks like a completed correction: deep, fast, and finished with momentum washed out while the round $60 handle was reclaimed within days.
Wednesday's push to $65.50 made a two-month high, the first since the crash leg ended. A market that capitulates, builds a five-week base and then prints fresh multi-week highs on a new driver is usually done correcting. That's the shape we look for: the low arrives first, and the macro reason arrives after it.
The structural read resolves bullish, and one condition breaks it
Here's the full read, in plain terms. The Treasury just showed it will not let the long end trade freely at 2007 yields, and inflation is still too sticky for the Fed to declare victory. That mix compresses real yields, which is the strongest macro fuel monetary metals ever get. Silver takes that fuel into a market running its sixth straight physical deficit, with the metal back in the lead over gold since the July capitulation. The trend, the driver and the physical balance all point the same way: structurally higher, with the usual violent shakeouts along the road.
You should also know where we are wrong, because every read has that place. The thesis breaks if the market calls the Treasury's bluff. Watch two things together: a weekly close in the 30-year yield back above Monday's pre-announcement high, and silver failing back below Tuesday's $63.34 launch level. If both print, the official bid failed, and silver goes back to trading as an industrial cyclical into a slowdown.
Until that happens, dips back into the old range are part of a trend rather than the end of one. The buyback window itself runs to November 4, so the market gets eleven weeks of scheduled official bids to trade against. That's the public map, and the timing of when to act on it is a different job.
Know your entry, your exit, and where you are wrong on Silver
The Treasury's buyback doubling is the surface signal. Silver is on the Kunkel Capital watchlist: the full research maps the current wave count to a defined entry zone, an exit target and the exact invalidation level, refreshed on a fixed rotation, with alerts when levels hit. €19.99 first month, then €34.99. Cancel anytime.
Frequently asked questions
Why did silver rise when the Treasury announced bond buybacks?
The buyback doubling pushed long-term yields down, which lowers the real (after-inflation) return on bonds. Silver pays no coupon, so it gains appeal whenever real bond returns shrink. It also carries a physical supply deficit, which makes its response to the same driver sharper than gold's.
Is the Treasury doing yield curve control?
The Treasury does not use that label. It frames the operations as liquidity support for older, thinly traded bonds. But doubling them to at least $4 billion per operation, two days after the 30-year hit its highest yield since 2007, works like a soft cap in practice. The market trades the bid, not the name.
Why is silver beating gold right now?
Both metals respond to compressed real yields, but silver adds a sixth straight annual supply deficit and a much smaller market. Silver gained about 14 percent in the past month against gold's 9.5, and it is up about 71 percent year over year. The gold-silver ratio, which had snapped back to 69 during silver's summer flush, turned lower again this week.
What would break the bullish silver read?
A weekly close in the 30-year yield above its pre-announcement August high, while silver trades back below the level it launched from on August 19. That combination would mean the Treasury's bid failed and the macro engine behind the move stalled.
Sources: U.S. Treasury, Reuters, Silver Institute.
Last updated: 2026-08-20