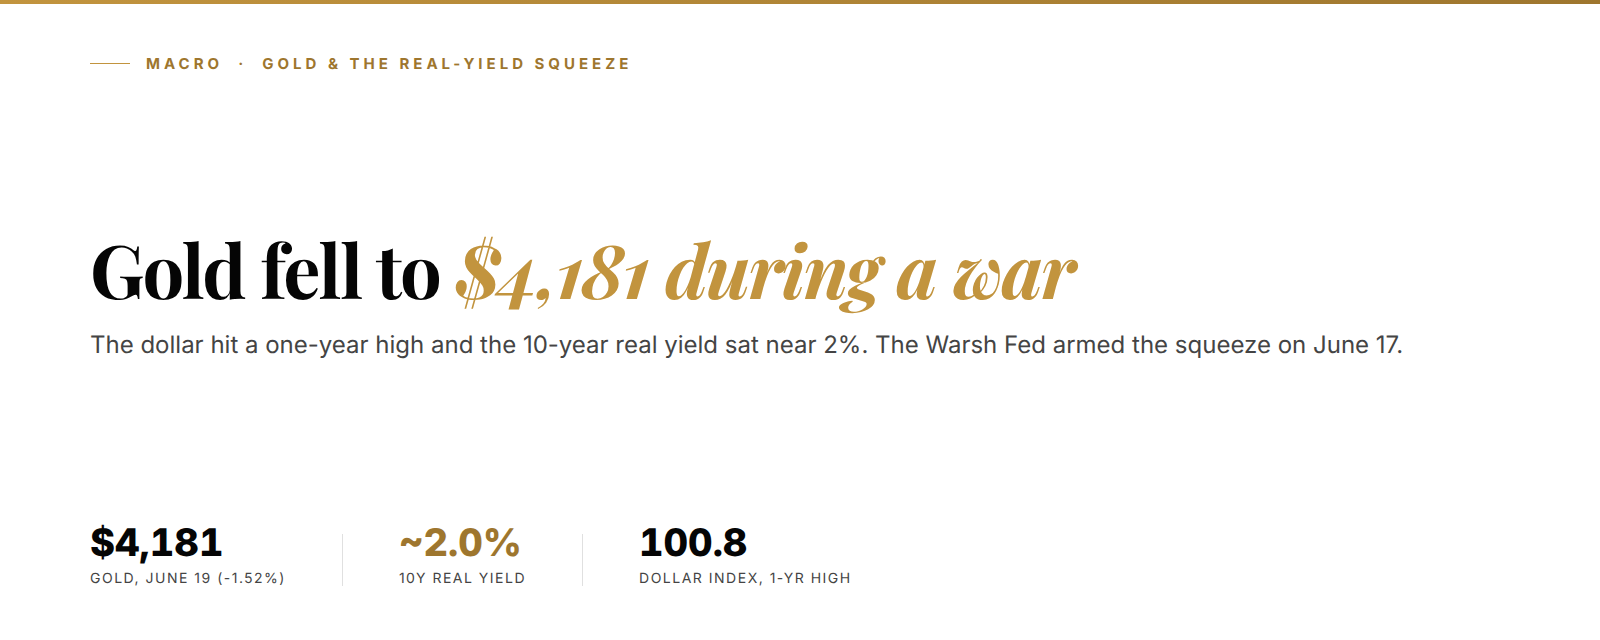
Gold fell to $4,181 on Friday, even with a Middle East war on the screen. That's the trade that wasn't supposed to happen. War is supposed to bid gold. This week it didn't. The dollar index hit a one-year high near 100.8, the 10-year Treasury yield held at 4.46%, and gold lost 1.52% in a single session. Real yields did the damage. A real yield is what a bond pays you after you subtract expected inflation. As of June 19, 2026, that number sat near 2%, the highest in months. The Warsh Fed armed the squeeze on June 17.
The setup in 3 lines:
- Gold lost 1.52% to $4,181 on June 19 while a regional war raged and the dollar hit a one-year high.
- The driver is the real yield near 2%, after the Fed's June 17 dot plot flipped from a cut to a hike.
- We read this as a liquidity flush inside a structural bull, not the top. The central-bank bid is still under it.
At 2:00 p.m. Eastern on June 17, the Federal Reserve published one page that changed the math on every gold position. The dot plot, the grid where each official marks a rate forecast, moved the median year-end 2026 rate to 3.8%. In March that number was 3.4%. Nine of eighteen officials now pencil in a hike this year. Only one sees a cut. That single page turned gold's biggest tailwind into a headwind in an afternoon.
Gold's 1.52% drop during a war broke the rule every beginner learns first
War bids gold. That's the first rule most traders learn. Tanks roll, missiles fly, and money runs to the one asset no government can print. So when the Middle East stayed hot into the weekend, the textbook said gold should rip.
It did the opposite. Gold closed Friday at $4,181, down 1.52%. Brent crude sat near $79 a barrel. The war premium that lifts oil never reached the metal. You can see the divergence on any screen. Oil twitchy. Gold heavy.
Here's the tension. The fear trade and the rate trade pull gold in opposite directions. This week the rate trade won, and it wasn't close. The dollar index printed a one-year high near 100.8. When the dollar is that strong, every ounce priced in dollars gets more expensive for the rest of the world to buy.
Translation: the war wanted to push gold up, and the dollar pushed harder the other way. The screen showed who was stronger.
Real yields near 2% are the only number that moved gold this week
Real yields are the whole story, so let's make them simple. Picture two ways to park cash. One is a Treasury bond that pays you interest after inflation. The other is a gold bar that pays you nothing. When the bond's real payout climbs, the gold bar looks worse by the hour. Nothing about gold changed. The competition got better.

As of June 19, the 10-year real yield sat near 2%. That's a steep number by the standards of the last decade. The nominal 10-year yield held at 4.46%, and traders stopped expecting the Fed to cut it back down. So the real cost of owning a metal that throws off zero income jumped.
Think of it like renting a parking spot for your money. Gold's spot is free, but it earns nothing. The bond's spot now pays rent. When the rent on the bond spot rose this week, parking in gold got expensive on a relative basis.
2%. That's the 10-year real yield that did more to gold this week than any headline out of the Middle East.
We have written before on why this link can break for months and then snap back hard. The mechanism is old, but the timing is what hurts. This week it snapped back. For the longer version of that decoupling, see our note on how real yields stopped predicting gold earlier this cycle.
Warsh's first dot plot traded cuts for hikes, and the dollar ripped
Kevin Warsh ran his first meeting as Fed Chair on June 17. The vote to hold rates at 3.50% to 3.75% was unanimous, 12 to 0. The boring part. The loud part was the projection grid.
The dot plot flipped. Officials moved the median 2026 rate up to 3.8% from 3.4%, and 17 of 18 judged inflation risks tilted to the upside. Rate traders now price a possible hike as soon as September. Months ago they were pricing cuts. That is a full reversal in the thing that matters most to gold: the path of real rates.
The dollar read the page in seconds. The US Dollar Index stormed back through the 100 handle to a one-year high, per the Federal Reserve's own daily rate data and the move in the index that followed. A hawkish Fed pays the dollar to wait. So the dollar got bought, and gold got sold against it.
Put differently: the new Chair told the market that rates may go up, not down. The dollar believed him. Gold paid the bill. If you want the mechanics of how a single Fed projection reprices the curve, our two-year yield and the Fed-hike pivot breakdown walks through the same plumbing.
Gold now trades like a risk asset, with an S&P correlation near +0.90
Here is the part most coverage missed. Gold isn't acting like a safe haven right now. It's acting like a risk asset, and the data says so.
For stretches of 2026, gold's correlation to the S&P 500 ran near +0.90. That means gold and stocks moved together, not apart. A real safe haven zigs when stocks zag. Gold has been zigging with them. So when the dollar and yields squeezed liquidity this week, gold sold off like a tech stock, not like insurance.
Why does that happen? When real yields spike, the biggest holders sell their most liquid winners first to raise cash. Gold is liquid and it's up huge this year. It sat from a January record above $5,600 down to the low $4,000s by June. That makes it a prime source of cash when the screen turns red. The selling is mechanical, not a verdict on gold.
Wait, we should be honest here. That +0.90 reading isn't permanent. The correlation has flipped twice this year already, hard and fast. We can't promise it holds next month. What we can say is that this week, gold traded with the risk crowd, and that explains the drop better than any war headline does.
Central banks bought 244 tonnes in Q1, and that floor hasn't moved
Now flip to the side nobody sold. While funds dumped gold for cash this week, the buyers underneath never left. The World Gold Council reported central banks bought a net 244 tonnes in the first quarter of 2026. That's up 3% from a year earlier, and it happened at record-high prices.
Look at who showed up:
- Poland's central bank added the most, 31 tonnes, extending a multi-year reserve build.
- Uzbekistan added 25 tonnes, steady accumulation through the price highs.
- The People's Bank of China added 7 tonnes, its public buying ongoing.
- First-time buyers joined the list: Guatemala, Indonesia, Malaysia, Cambodia, Uganda, and Kenya.
- The price dipped during the quarter, and the official buyers added more, not less.
This is the part that separates a flush from a top. Funds trade the real yield. Central banks trade the decade. They're buying gold to hold fewer dollars, and a one-year high in the dollar doesn't change that plan. It arguably hardens it.
244 tonnes. That's the central-bank gold bid that kept buying while the screen sold off.
Translation: the fast money sold this week, and the slow money kept buying. One is a trade. The other is a floor.

We track that split closely, and it's the same pattern we flagged in the gold $4,152 Warsh flush note when the official bid absorbed an earlier dip.
Our read: a liquidity flush inside the bull, not the top
So where does this leave the positional read? We see a liquidity flush, not a trend break. The structure that matters still points up, and the buyers under the market never blinked.
Gold ran from the low $4,000s after a January spike, corrected through the spring, and now sits at $4,181 after this week's hit. The wave structure we map keeps the larger uptrend intact as long as the metal holds its prior reaction low. That zone, the area where gold last based before its leg higher, is the line we watch. Lose it on a closing basis, and the flush gets deeper. Hold it, and the dollar spike becomes the buy.
The honest uncertainty: real yields could keep climbing if the Fed actually hikes in September. That would press gold further before the bid wins. We don't know the September outcome. Nobody does. What we do know is the setup. A war that can't lift gold tells you the rate trade owns the tape. A dollar one-year high tells you the squeeze is mature, not young. And a 244-tonne quarter tells you the floor is real.
That's the entire game right now.
If you're tracking the cross-asset side of this, the dollar squeeze is showing up in funding markets too, which we covered in cross-currency basis and dollar stress and in the gold $4,150 hawkish-Fed pullback read.
See the full gold real-yield setup
The $4,181 flush and the real-yield squeeze are the surface signal. The Kunkel Capital research adds the exact wave count on gold, the Fibonacci retracement zone we're watching as the flush floor, the dollar-index level that flips the trade, and the position-sizing template for adding into the central-bank bid. €19.99 first month, then €34.99. Cancel anytime.
Frequently asked questions
Why did gold fall during a Middle East war in June 2026?
Gold fell to $4,181 on June 19 because real yields and the dollar overpowered the war bid. The 10-year real yield sat near 2% and the dollar index hit a one-year high after the Fed's June 17 dot plot turned hawkish. Higher real yields raise the cost of holding gold, which pays no income, so funds sold it for cash.
What is a real yield and why does it move gold?
A real yield is a bond's interest rate after subtracting expected inflation. When real yields rise, a bond that pays you looks better than gold, which pays nothing. So gold tends to fall as real yields climb, and rise as they drop. This week the 10-year real yield near 2% was the main weight on the price.
Did the Warsh Fed actually signal a rate hike?
The Fed held rates at 3.50% to 3.75% on June 17, but its dot plot moved the median 2026 rate to 3.8% from 3.4%. Nine of 18 officials pencilled in at least one hike this year, and 17 of 18 saw inflation risks to the upside. Rate traders now price a possible hike as soon as September.
Are central banks still buying gold at these prices?
Yes. The World Gold Council reported central banks bought a net 244 tonnes in the first quarter of 2026, up 3% year over year at record prices. Poland added 31 tonnes, Uzbekistan 25, and China 7, with first-time buyers including Indonesia and Malaysia. The official bid kept buying as funds sold.
Is this gold drop the top or a pullback?
We read it as a liquidity flush inside a structural bull, not a top. Funds sold the most liquid winner to raise cash as real yields spiked, while the central-bank floor held. The key level is gold's prior reaction low. A close below it deepens the flush. A hold turns the dollar spike into a buy.
Last updated: 2026-06-22
Kunkel Capital Research. Daily market structure, Elliott Wave and Fibonacci. Not investment advice. Markets carry risk, and you are responsible for your own decisions.