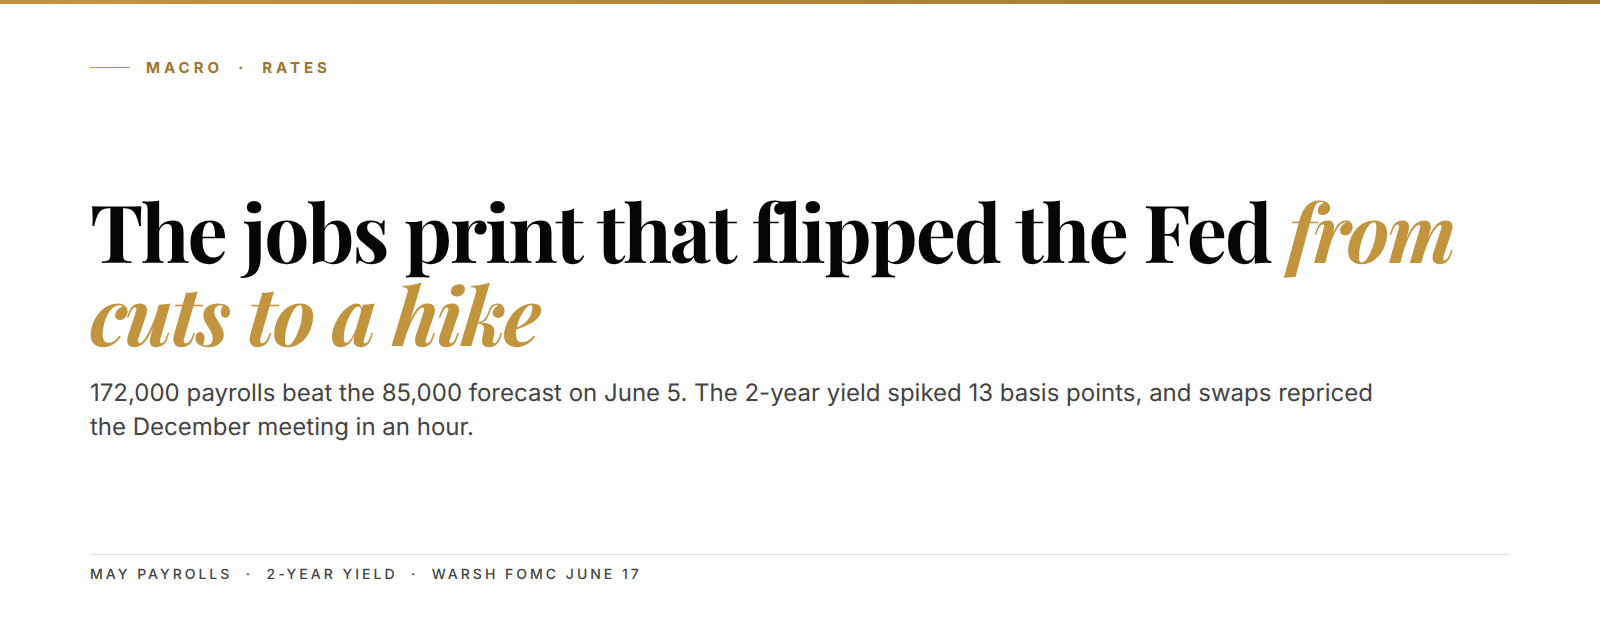
The 2-year Treasury yield jumped 13 basis points to 4.17% on Friday, June 5, its sharpest one-day move since the April 2025 tariff shock. The consensus going into the print wanted a cooling labor market. It wanted the cover for rate cuts. Instead, payrolls came in at 172,000 for May, nearly double the 85,000 economists had penciled in, and the front end of the curve repriced in minutes. By the close, traders were no longer arguing about when the Fed would cut. They were pricing a hike.
That is the whole story in one sentence. The market spent six months leaning one way, and a single data release flipped it the other way before lunch.
The setup in 3 lines:
- May payrolls printed 172,000 versus 85,000 expected, with prior months revised up a combined 93,000.
- The 2-year yield, the bond most tied to Fed policy, spiked 13 basis points to 4.17%, and swaps now fully price a quarter-point hike by December.
- Kevin Warsh chairs his first FOMC on June 17, 2026, inheriting a board that was already drifting hawkish before this print landed.
Here is the part consensus keeps missing. At the confirmation of Warsh in late May, CME FedWatch still showed a 97% chance of no change at this meeting. Cuts were the base case for the back half of the year. Then 172,000 hit the tape Friday morning, and within an hour the rates strategists at BlackRock and every swaps desk on the Street were marking the same thing: the easing bias is dead. Not paused. Dead.
172,000 was nearly double the 85,000 economists penciled in
Start with the number, because the number is the trigger. Nonfarm payrolls rose 172,000 in May. The Street looked for 85,000. That is not a small beat. It is a miss of the entire forecast, twice over.

The unemployment rate held at 4.3%. Average hourly earnings rose 0.3% on the month, in line, but firm. Job gains clustered in leisure and hospitality, local government, and health care. Manufacturing added 7,000. None of it screamed late-cycle weakness.
Then came the revisions, and the revisions are where the soft-landing story quietly fell apart. March payrolls got marked up 29,000 to 214,000. April got marked up 64,000 to 179,000. Combined, the prior two months were 93,000 higher than the market thought a day earlier.
Translation: the labor market was not just strong in May. It was stronger than reported in March and April too. The cooling everyone had been trading was partly a measurement artifact that just got revised away.
172,000 versus 85,000. A double-the-forecast print is not noise. It is a regime tell.
The 2-year yield's 13-basis-point jump was its biggest one-day move since April 2025
The 2-year Treasury yield is the cleanest read on Fed expectations the market has. It tracks where traders think the policy rate sits over the next two years. When it moves 13 basis points in a session, the market is repricing the Fed itself, not the economy in general.
That is exactly what happened Friday. The 2-year ran to 4.17%, its biggest one-day rise since President Trump's tariff announcement rattled markets in April 2025. The 10-year, which sets the tone for mortgages and corporate borrowing, climbed more than 6 basis points to 4.544%, its highest since May 21.
Think of the 2-year like the thermostat reading in a house. It does not heat the room. It tells you what the furnace is about to do. When that reading jumps, the furnace is already kicking on.
The 30-year sat at 5.01% as of Friday's close, just under the 5.20% it touched on May 19, which was its highest level since 2007. We mapped that long-bond move in detail in our note on the 30-year clearing 5.2% as term premium turned positive, and the front-end spike now puts pressure on the whole curve from the short side.
Traders went from pricing cuts to fully pricing a hike by December
This is the reveal. The repricing was not subtle. Interest-rate swaps now show traders fully expecting a quarter-point Fed hike by the December meeting, with roughly a 60% chance of a move as soon as October. Bloomberg reported the swap curve flipped within hours of the release.
Read that again. The market is not pricing fewer cuts. It is pricing a hike. The sign on the trade reversed.

From cuts to a hike in one print. The swaps market moved the December meeting from "maybe ease" to "probably tighten" before the equity open.
Polymarket, where the crowd bets real money on outcomes, put the odds of a 2026 hike near 35% heading into the print. After Friday those odds firmed. The gap between the swaps market (roughly 60% by October on the policy-sensitive curve) and the prediction market (35%) is itself a tell. When professional rates desks lead retail betting by that wide a margin, the rates desks have usually seen it first.
Translation: the smart money repriced fast, and the slower money has not fully caught up. That gap is where positioning still has room to run.
Warsh inherits a hawkish crew and his first meeting is June 17
Now the structural piece. Kevin Warsh took office as the 17th Chair of the Federal Reserve on May 22. His first FOMC meeting runs June 16 to 17. He was Trump's pick, and the Street assumed that meant a dovish tilt and a path toward cuts.
The board he inherited says otherwise. As of the April meeting, at least five of the Fed's 19 policymakers wanted hawkish language stating a hike was as likely as a cut. Officials' worries about the Iran war stoking inflation intensified through May. A growing bloc wanted to lay the groundwork for a possible increase.
So Warsh walks into a room that was already turning before he sat down. He does not have to lead the hawks. He just has to not stop them. The June 17 meeting is widely expected to drop the easing bias outright, which would be the first formal step toward the hike the swaps market is now pricing.
Here is the wider context the energy desk has been flagging since the spring. Oil and gas sit at four-year highs while the Strait of Hormuz stays effectively shut. That feeds straight into the inflation side of the Fed's mandate, and it is the same force that pushed the long bond to a 19-year high in May. We traced that energy-to-rates channel in our breakdown of crude's spare-capacity squeeze.
April's 3.8% CPI is the inflation backdrop that makes this print dangerous
A hot jobs number alone does not force a hike. A hot jobs number on top of sticky inflation does. That is the combination now sitting on Warsh's desk.
April CPI ran 3.8% year over year, the hottest since May 2023, driven largely by energy. The Fed funds target sits at 3.50% to 3.75%. So the policy rate is barely above the inflation rate, which means real policy is far less restrictive than the headline suggests. The May CPI print lands June 10, two days after this post and one week before the meeting. It is the last major data point Warsh sees before he votes.
Wait, one honest caveat here. We do not know the May CPI number yet. If it comes in soft, the hike pricing unwinds fast and the 2-year gives back much of Friday's move. The swaps market is making a bet, not stating a fact. But the labor data raised the bar for a dovish surprise, and the energy backdrop is pulling the other way.
Translation: the jobs print did not seal a hike. It loaded the gun. Wednesday's inflation number decides whether anyone pulls the trigger.
This is the same regime shift that has been quietly rewriting the rates-to-gold relationship all year. Real yields rising while gold holds firm broke a decade-old correlation, which we walked through in our piece on why real yields stopped predicting gold.
The structural read: the front end has more room before the curve catches up
Here is the positional view, and it sits at the short end. The 2-year at 4.17% still prices only a partial hike. If the swaps market is right and a quarter point lands by December, the 2-year has room toward the 4.30% to 4.45% zone, the band it last held during the autumn 2025 inflation scare.
The shape of the move matters as much as the level. Friday was a bear flattener at the front. Short yields rose faster than long yields as the market pulled hike risk forward. That is the mirror image of the bear steepener that defined May, when the long bond led on term premium and fiscal worry. The two moves together describe a curve getting squeezed from both ends, a dynamic we tracked in our note on term premium returning to Treasuries.
Watch three levels into June 17. The 2-year at 4.30% confirms the hike is getting fully built in. The 10-year above 4.60% says the long end is following, not fading. And the dollar, which firmed Friday alongside yields, is the cross-asset confirmation that this is a real Fed repricing and not a one-day spasm. The global plumbing matters here too, and the strain shows up first in funding markets, as we covered in our work on cross-currency basis and dollar stress.
One more thread. A hawkish Fed and a firmer dollar usually pressure gold, yet gold absorbed the May payroll flush and held its bid. That divergence is its own signal, and we broke it down in our gold payroll-flush central-bank-bid analysis.
So the read is not complicated. The labor market is hot. Inflation is sticky. The new chair inherits a hawkish board. The front end has further to reprice, and the next instruction comes Wednesday.
That is the entire game right now.
Frequently asked questions
Why did Treasury yields rise on a strong jobs report?
A strong jobs report tells the Fed the economy can handle higher rates without breaking the labor market. That removes the case for cuts and raises the odds of a hike, so traders sell short-dated bonds and yields rise. The 2-year, the most policy-sensitive note, jumped 13 basis points to 4.17% on June 5.
What does the 2-year Treasury yield actually signal?
The 2-year yield reflects where the market expects the Fed funds rate to average over the next two years. It is the cleanest single read on Fed policy expectations, which is why it moves hardest on jobs and inflation surprises.
Is the Fed going to hike rates in 2026?
As of June 5, interest-rate swaps fully price a quarter-point hike by December, with about a 60% chance of a move by October. Nothing is decided. The May CPI release on June 10 and the June 17 FOMC under new chair Kevin Warsh are the two events that confirm or unwind that pricing.
Why does the Iran war matter for US interest rates?
The conflict has pushed oil and gas to four-year highs with the Strait of Hormuz effectively closed. Higher energy prices feed directly into inflation, which is the side of the Fed's mandate that argues for tighter policy. That is part of why the long bond hit a 19-year high in May.
What should traders watch into the June 17 meeting?
Three levels. The 2-year toward 4.30% confirms the hike is being built in. The 10-year above 4.60% says the long end agrees. A firmer dollar is the cross-asset confirmation that the repricing is real.
See the full payrolls-to-Fed setup
The 2-year's 13-basis-point spike is the surface signal. The Kunkel Capital research adds the front-end target zones, the curve-shape map into June 17, the dollar and gold cross-asset reads, and the sized rates entry with levels. €19.99 first month, then €34.99. Cancel anytime.
Last updated: 2026-06-08