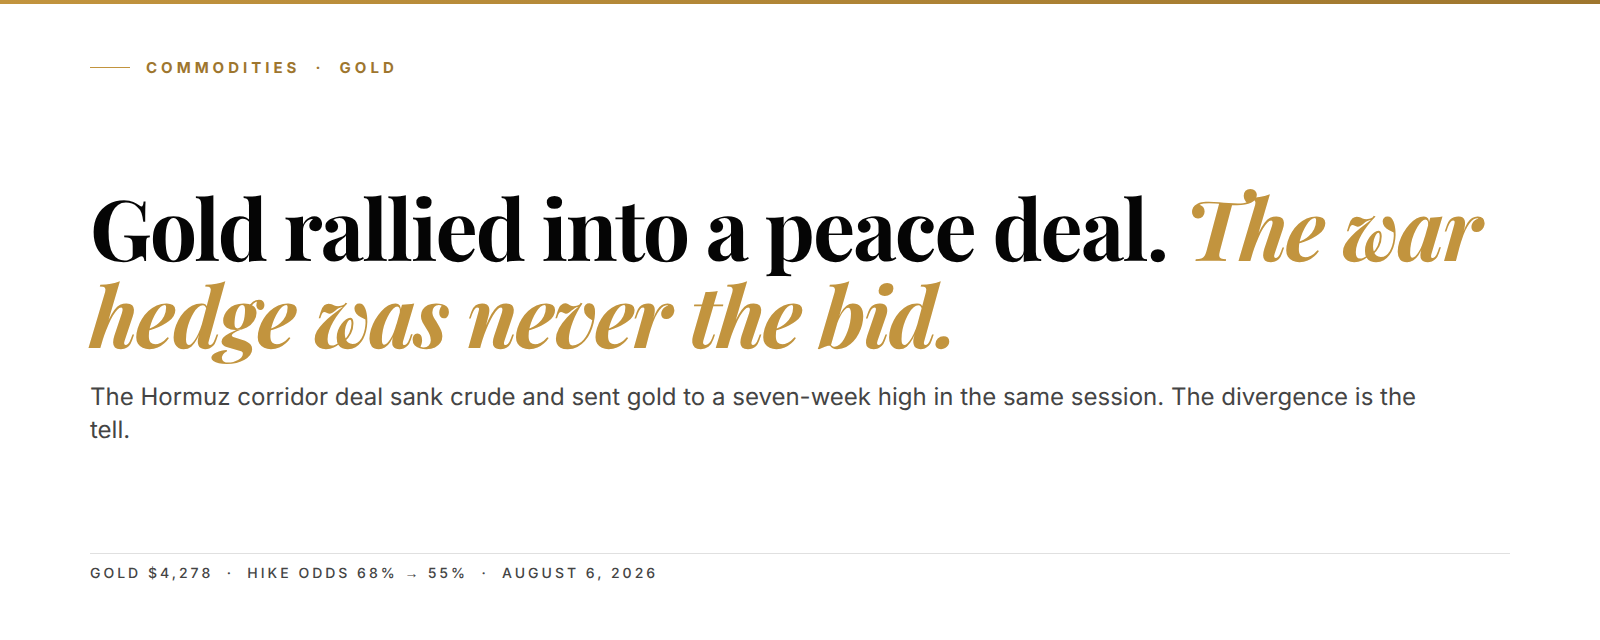
Gold printed $4,278 an ounce on Thursday morning, August 6, its fourth straight up session and a seven-week high. The consensus says gold is a war hedge, so a peace deal in the Strait of Hormuz should have knocked it down. Instead, the same headline that dropped WTI crude under $76 sent the metal up almost 6% off Friday's close. Gold is rising because cheaper oil cut Fed rate-hike expectations, and lower hike odds make a zero-coupon metal easier to hold. The war was never the bid.
The setup in 3 lines:
- Gold ran from the $4,100 shelf to $4,278 in four sessions after Iran and Oman agreed on a corridor to partially reopen the Strait of Hormuz.
- Cheaper oil pulled September Fed hike odds from 68% to 55% in a single day on CME FedWatch, and year-end pricing went from two hikes to one.
- The move confirms the two-bid structure we've tracked since June: central banks hold the floor near $4,100, and rate pricing swings the price above it.
The tape gave you a named moment to hang this on. On Tuesday, August 4, President Trump told reporters a Hormuz deal could land "as early as Wednesday." Bloomberg reported that evening that corridor progress was already trimming rate-hike bets. By Wednesday the Iran-Oman shipping agreement was public, crude was on its lows, and gold was bid for a third straight session. A war hedge doesn't rally into a ceasefire. Something else does, and this week showed exactly what.
Crude lost its war premium and gold rallied on the same headline
Oil and gold read the corridor news in opposite directions, and that split is the most honest data point of the week. WTI slipped toward $75 as traders priced Gulf cargoes flowing again, the same fade we graded in our crude war-premium post-mortem back in June. Gold took the identical headline and ripped. If both assets carried the same geopolitical premium, they'd have deflated together.
They didn't, because the premium was never sitting in gold to begin with. We made that case in Brent's phantom OPEC barrels: the war trade lived in the energy complex, where a closed strait threatens actual physical supply. Gold's link to the conflict always ran through a side door. A blocked Hormuz meant expensive oil, expensive oil meant sticky inflation, and sticky inflation meant a Federal Reserve forced to keep hiking.
So when the strait reopens, that chain runs in reverse. Oil falls and the inflation path softens with it. Hike pressure bleeds out of the curve. For crude that's bearish, and for gold it's fuel. One headline, two opposite tapes, and both moves are rational once you stop reading gold as a fear trade.
September hike odds fell from 68% to 55% in a single session
Here's the transmission in numbers. On Monday, CME FedWatch had the odds of a September rate hike near 68%. By Tuesday's close, after the corridor headlines, they sat around 55%, and markets that priced two hikes by year-end a week ago now price one. The two-year yield eased alongside the odds. The dollar softened for a third day.

Translation: the market quit pricing two more hikes. And gold got paid on the difference.
68% to 55%. September hike odds collapsed in one session when the corridor headline hit. That repricing, not the ceasefire, is what gold bought.
The mechanism matters because it's the same one that worked in reverse all summer. Kevin Warsh's first meeting as Fed chair on June 17 flipped the projection sheet from a 2026 cut to a 2026 hike. The two-year jumped 16 basis points that session, and gold got run from the low $4,300s to the $4,152 flush. The 172,000 payroll print in June did the same damage through the same channel. Rate pricing drove every leg down. Now it's driving the first sustained leg up.
And that cuts against something we published in June, so let's be straight about it. We argued that real yields stopped predicting gold after the 2022 reserve-freeze broke the old correlation. Wait, actually, that claim needs sharpening rather than retracting: the one-factor model is dead as a level predictor, because central banks now set the floor regardless of the curve. But the marginal week-to-week flow still trades Fed pricing, and this week is the cleanest proof since the flip.
The war-hedge story failed every test the summer tape threw at it
Run the war-hedge theory through 2026 and it misses every checkpoint. Gold set its $4,562 record on May 26. The Gulf was quiet in that stretch, not escalating. Then it lost $400 over June and July while missiles were still a live risk and the strait stayed shut, which is the exact window a fear premium should have peaked. The selling traced to Warsh and payrolls, not to peace.
Now the sequence completes: the biggest de-escalation headline of the year arrives, and gold posts its best week since spring. Every directional test lands on the same answer. The metal trades money, not war.
That's worth spelling out because the war-hedge frame is about to get loud again. If the corridor deal wobbles, you'll hear that gold needs the conflict to stay bid. The summer says otherwise, and positioning data backs it up: managed money puked length into both rate-driven flushes while the geopolitical backdrop never changed. In plain terms, the fast money was trading FedWatch, not the Strait of Hormuz.
What the four-day tape settled:
- Gold rallied on de-escalation, so the bid isn't a war premium.
- Crude fell on the same news, which is where the war premium actually lived.
- Hike odds repriced from 68% to 55%, and gold tracked the repricing tick for tick.
- Year-end Fed pricing went from two hikes to one, the largest dovish shift since the Warsh flip.
- Central-bank buying ran through the whole cycle, up moves and flushes alike.
Central banks held the $4,100 floor while the Fed set the ceiling
The floor under this market has a buyer list, and it's not hedge funds. The World Gold Council logged 244 tonnes of official-sector demand in Q1 2026, up 21% year over year, with the People's Bank of China adding for a seventh straight month through April. This week the Bank of Korea joined the queue, with its reserve managers signalling fresh purchases even as the Hormuz risk that supposedly justified gold faded. These buyers didn't blink at the record. They didn't blink at the flush either.
244 tonnes. Official-sector demand in Q1 2026 per the World Gold Council. The buyers who built the $4,100 floor weren't trading headlines, so the floor didn't move when headlines did.
That's why every rate-driven flush since June died in the same zone. The Warsh flush stopped at $4,152. The payroll flush stopped near $4,340 and later probes held the $4,100 shelf, a level any free chart shows. Price-insensitive buyers absorb what the fast money pukes, which just means the downside kept shrinking while the upside stayed hostage to the Fed.
Put the two bids together and the summer makes sense as one structure. Central banks set a floor that headlines can't break, and rate pricing sets how far above the floor the metal can run. All summer the Fed channel pointed down, so gold ground lower onto the floor. This week the channel flipped up for the first time since June 17. The floor didn't have to move for the price to run; the ceiling did.
The June-July decline now reads as a completed correction, not a broken cycle
Our May read called the $4,380 zone the wave-four low after the $4,562 record. That call was early, and we own it: once Warsh flipped the dots, the correction extended eight more weeks and roughly $200 deeper before the shelf held. The structure survived while the timing didn't, which is the difference between a wrong count and a wrong week.
What upgrades the read now is the character of the bounce. Corrective rallies inside a downtrend are choppy, overlapping, and quick to fade. This week's advance looks nothing like that. It shows four consecutive closes, expanding range, a fresh seven-week high, and a macro driver flipping in the same direction. That's impulse behavior off a defended floor. It's also the first such sequence since the record.

Think of the summer like a coiled spring under a weight. The central-bank bid kept compressing the downside all through July, and the hawkish Fed was the weight sitting on top. The corridor deal didn't add any buying pressure of its own. It just lifted the weight, and the spring did the rest. Gold is one of the assets on the Kunkel Capital rotation: members get the full structure map with entry, exit and invalidation refreshed on a fixed cycle.
A dying deal, not a new war, is what breaks this read
The honest risk here isn't another strike in the Gulf. By the logic above, escalation would hurt gold through the rate channel, since expensive oil would put the second hike back on the table. The real threat to the recovery read is the deal failing slowly. And there's genuine uncertainty in it: the corridor only partially reopens the strait, mines still need clearing, and Iran has walked back deals before. Friday's July employment report is the nearer tripwire. A hot print could restore hike odds no matter what ships do.
So here is where we are wrong. If the corridor arrangement collapses and September hike odds reprice back toward the two-hike path while gold closes back below the $4,100 shelf it defended through July, the recovery read breaks. That would mean the correction from the record is still running. It's an invalidation stated as behavior, and you can watch it on any free chart. Until that combination prints, the four-day tape stands as the tell. The floor is sovereign, the swing is the Fed, and both now point the same way for the first time since the record.
As of August 6, that's the read. The two-year yield into Friday's payroll print is the next thing on the screen that can change it.
Frequently asked questions
Why did gold go up when the Hormuz peace deal was announced?
The deal dropped oil prices, which softened the inflation path the Fed was hiking against. September hike odds fell from 68% to 55% on CME FedWatch. Year-end pricing went from two hikes to one, and gold rallied on the easier rate outlook. The war premium was in crude, not in gold.
Is gold still a safe-haven asset in 2026?
Against monetary and sanctions risk, yes; against headlines, less than the label suggests. Central banks bought 244 tonnes in Q1 2026 as reserve insurance, and that bid is structural. But gold's week-to-week swings now track Fed pricing, which is why it fell during June's escalation and rallied into this week's de-escalation.
What would make gold fall from here?
A failed corridor deal plus a hot July payroll print on Friday would rebuild the case for two more Fed hikes. That exact combination pressured gold all through the summer. The read breaks if hike odds reprice toward two hikes and gold closes back below the $4,100 area it defended in July.
How far is gold from its record high?
The record close sits at $4,562 from May 26, 2026. At $4,278, gold trades about 6% below it after recovering most of the June-July decline's final leg in four sessions.
Know your entry, your exit, and where you are wrong on Gold
The rate-channel flip is the surface signal. Gold is on the Kunkel Capital watchlist: the full research maps the current wave count to a defined entry zone, an exit target and the exact invalidation level, refreshed on a fixed rotation, with alerts when levels hit. €19.99 first month, then €34.99. Cancel anytime.
Last updated: 2026-08-06