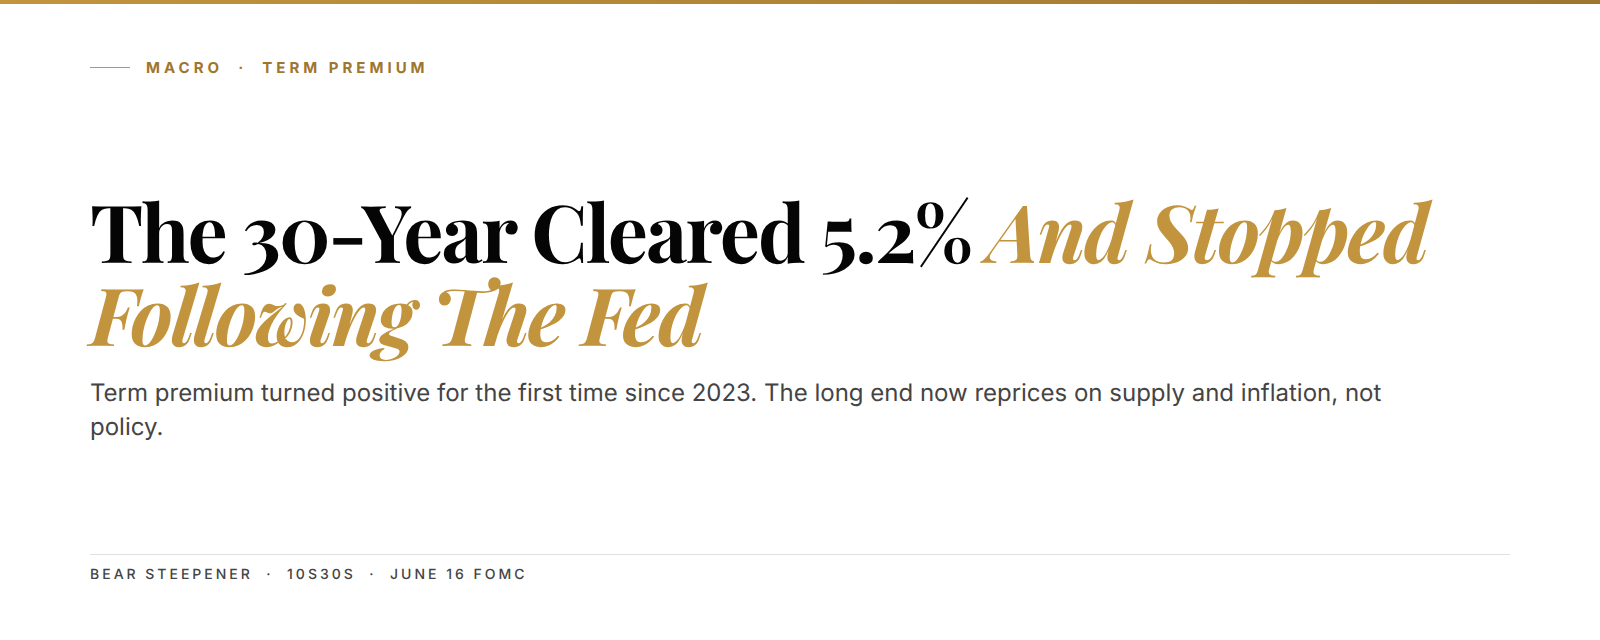
Thirty-year Treasury yields cleared 5.2% in May, the highest print since 2007, and the move broke a rule most investors treat as law. The textbook says long rates follow the Fed: cut the funds rate, and the whole curve drops with it. That rule just broke. The front end stayed anchored while the long end kept selling off anyway. The reason is the term premium. That's the extra yield investors demand to hold a long bond instead of rolling short bills, and it flipped positive in May for the first time since 2023.
The setup in 3 lines:
- The New York Fed's term premium gauge went positive in May, its first positive reading since 2023, and it now sits near a 12-year high.
- A bear steepener is running, with the 10-year near 4.46% while the 30-year cleared 5.2%, so the long end reprices on supply and inflation rather than Fed policy.
- Watch the 30-year, because a hold above 5% into the June 16 FOMC says the term premium regime is sticking rather than fading.
BlackRock's bond team had already moved underweight long-dated Treasuries weeks before the move, and they turned out to be early and right. On May 19, a 30-year auction tailed and the yield jumped six basis points to 5.19% inside a single session. The buyers who demanded more yield got exactly what they asked for. That auction was the tell.
Term premium went positive in May, and that flips the playbook
Term premium is the reward you collect for locking money into a 30-year bond instead of rolling 3-month bills over and over. For most of the 2010s that reward was negative, so buyers paid up for duration and got nothing extra, sometimes less. That was the strange regime nobody questioned for almost a decade. Then it flipped.
The New York Fed's ACM model put the 10-year term premium back in positive territory in May, the first positive reading since 2023, and most measures now sit near a 12-year high. The number itself is less important than the sign change.

Translation: for years, holding the long bond paid no reward for the risk, and now it does. The buyer sets the price again.
Here's why that matters for everyone, not just bond desks. When term premium is negative, Fed cuts drag the whole curve down together in lockstep. When it turns positive, the two ends can split, so the Fed can ease the front while the long end climbs on its own. That's the world we just walked into, and it rewires how stocks, mortgages, and net liquidity cycles feed through to risk assets.
The 5.2% print came from supply and inflation, not from the Fed
Two forces pushed the 30-year to 5.2%, and neither one is the funds rate. Start with supply, because the Treasury is selling close to $2 trillion in net new debt a year to fund the deficit. Someone has to buy all of it. Buyers won't show up without more yield.
Then add the inflation scare that ran underneath the whole month. Oil climbed to a four-year high through May as the Iran conflict threatened the Strait of Hormuz, and April CPI came in at 3.8% year over year. A 30-year bond is really a bet on average inflation out to 2056, so higher oil and stickier prices make that bet look worse by the day. We tracked the physical side of that oil move in Brent's backwardation.
$2 trillion a year. That's the net new Treasury supply the long end has to swallow, a deficit with no end date attached.
The auctions tell the story in real time. On May 13, the Treasury sold $25 billion in new 30-year bonds at 5.046%, the first 5-handle on a long-bond sale since 2007. A week later the screen yield pushed past 5.19%, and each sale since has cleared a touch cheaper, which means a touch higher in yield. Dealers take down what the public won't, then mark it down to move it. That's what a buyers' strike looks like up close.
Translation: the government keeps printing bonds, and the world keeps asking for a bigger discount to take them.
Think of it like a wheat farmer locking in next year's grain price. He isn't guessing the market. He's protecting his harvest. The futures lock is his insurance. The bond buyer runs the opposite math entirely. He's asked to lock in a price for 30 years while the supply keeps growing and the weather keeps getting worse, so he wants a discount. That discount is the term premium, and it shows up as a higher yield.
This is a bear steepener, and 10s30s hasn't moved like this since 1990
A bear steepener means long yields rise faster than short yields, so the curve steepens while everything sells off together. We're in one now. The 10-year eased to about 4.46% after a US-Iran interim deal cooled the oil bid, while the 30-year stayed up near 5.2%, and that widening gap is the steepener itself.
The 10s30s spread, the distance between the 10-year and 30-year yields, has widened almost as much as the 2s10s this cycle. That pattern hasn't shown up since the Fed began publishing target-range guidance in 1990. The long end now trades like a risk asset rather than a safe one.

4.46% versus 5.2%. The 10-year and the 30-year are telling two different stories, and the long end is the one that pays your mortgage.
Translation: the part of the curve everyone treats as the risk-free anchor is the part throwing the tantrum.
Why does the front end stay so calm through all of this? Because the Fed sets it directly through the funds rate, and the 2-year just tracks where traders think policy goes over two years. The 30-year is a different animal entirely. No central banker sets it. It gets priced by whoever shows up to buy 30 years of US fiscal risk, and right now they show up cheap. Most traders never watch the 30-year. They should.
Here's the uncomfortable part for anyone with a mortgage or a stock portfolio. A steepener led by the long end tightens financial conditions without the Fed lifting a finger, because mortgage rates ride the 10-year and the 30-year, not the funds rate. So housing and corporate borrowing get squeezed even with the funds rate sitting still.
Japan's record 30-year yield on May 28 is the same story in another currency
Japan printed the same signal three days before month-end. On May 28, the Japanese 30-year yield hit 3.97%, a record going back to when the bond launched, while core inflation there pushed above the 2% target and the Bank of Japan edged toward another hike. Tokyo's problem rhymes with Washington's.
A 20-year JGB auction in late May drew the weakest demand in over a decade, and that matters far beyond Japan. When the biggest creditor nation struggles to place its own long bonds, the message travels fast. This isn't a coincidence across two countries, it's one regime in two currencies. Long-dated government debt is repricing everywhere at once, because the same forces, deficits, supply, and sticky inflation, sit under all of it.
For dollar investors, the cleaner read often shows up in the cross-currency basis before the cash bond fully marks the stress. Rising JGB yields also drain the yen carry trade that funded global risk-taking for years. We mapped the Japanese long end when the 40-year yield repriced, and the through-line hasn't changed since.
Five things a positive term premium quietly breaks
A positive term premium isn't a bond-desk curiosity, because it reprices almost anything valued off the long bond. Here's the short list.
- Equity multiples. Discounted cash flow models start with the 10-year, so higher long yields shrink the value of far-off earnings and hit long-duration tech hardest.
- Mortgage rates. The 30-year mortgage rides the 10-year plus a spread, so a higher anchor keeps housing tight even when the Fed isn't hiking.
- The 60/40 portfolio. Bonds stop hedging stocks the moment both fall together on the same yield shock, which is exactly what a steepener delivers.
- Pension funding. Plans discount their liabilities off long yields, so the funding math swings hard with every 50 basis point move in rates.
- Carry trades. Cheap-funding bets all assume the long end stays put, so pulling that anchor makes the whole trade wobble at once.
There's a knock-on effect in commodities too. We showed how real yields stopped predicting gold cleanly once the term premium started doing its own thing again. The old links between rates and other assets loosen badly in this kind of regime.
We dug into how this whole setup rebuilt itself in the term premium return piece, and the short version is simple. The old world priced duration as free. The new one charges real money for it.
Where the curve sits into the June 16 FOMC
Step back from the tick-by-tick for a moment. The Fed meets June 16 and 17, and the market puts the odds of a hold near 98%, so the June decision probably won't move the long end much at all. The long end has stopped asking the Fed for permission.
Watch one level above all the others. A 30-year that holds above 5% through the meeting says the term premium regime is setting in rather than fading out. A drop back under 4.8% would say the Iran-driven inflation scare did most of the heavy lifting, and that some of this unwinds from here.
We'll be honest about the other side of this. If the Strait of Hormuz stays open and oil falls hard, the inflation premium bleeds out fast, and the long end cools with it. The 10-year already slid from a 4.7% high on May 20 toward 4.46% on the interim-deal headlines, so the path is clearly choppy. We don't think it breaks the trend. But we do think it makes the next month bumpy.
You don't need to own a 30-year bond to sit inside this story. If you hold long Treasuries, US tech, or any asset that floated on cheap money, the anchor under it is lifting right now. The number to write down today is 5.2% on the 30-year, and the number to watch next is 5% on the way down or 5.4% on the way up. One of those two prints first.
Frequently asked questions
What is a bear steepener?
A bear steepener is when long-term yields rise faster than short-term yields, so the curve steepens while bond prices fall across the board. In May 2026, the 30-year cleared 5.2% while the 10-year sat near 4.46%, which is the textbook shape.
Why is the term premium positive again?
Three forces stacked up at once. There's near $2 trillion a year in Treasury supply, large deficits with no plan to shrink them, and an oil-driven inflation scare. Together they push buyers to demand more yield for holding long bonds.
Does a Fed cut still lower long-term yields?
Not reliably anymore. With a positive term premium, the Fed can ease the front end while the long end climbs on supply and inflation, so the two parts of the curve can move apart instead of together.
What level should I watch on the 30-year?
The 5% line is the one that matters. A 30-year that holds above 5% into the June 16 FOMC says the term premium regime is sticking. A break back under 4.8% would point to the inflation scare fading instead.
See the full term premium setup
The 5.2% thirty-year print is the surface signal. The Kunkel Capital research adds the level map across the 10-year and 30-year, the curve-steepener watchlist, and the multi-quarter target path that ties Treasuries to JGBs and the dollar. €19.99 first month, then €34.99. Cancel anytime.
Last updated: 2026-06-01