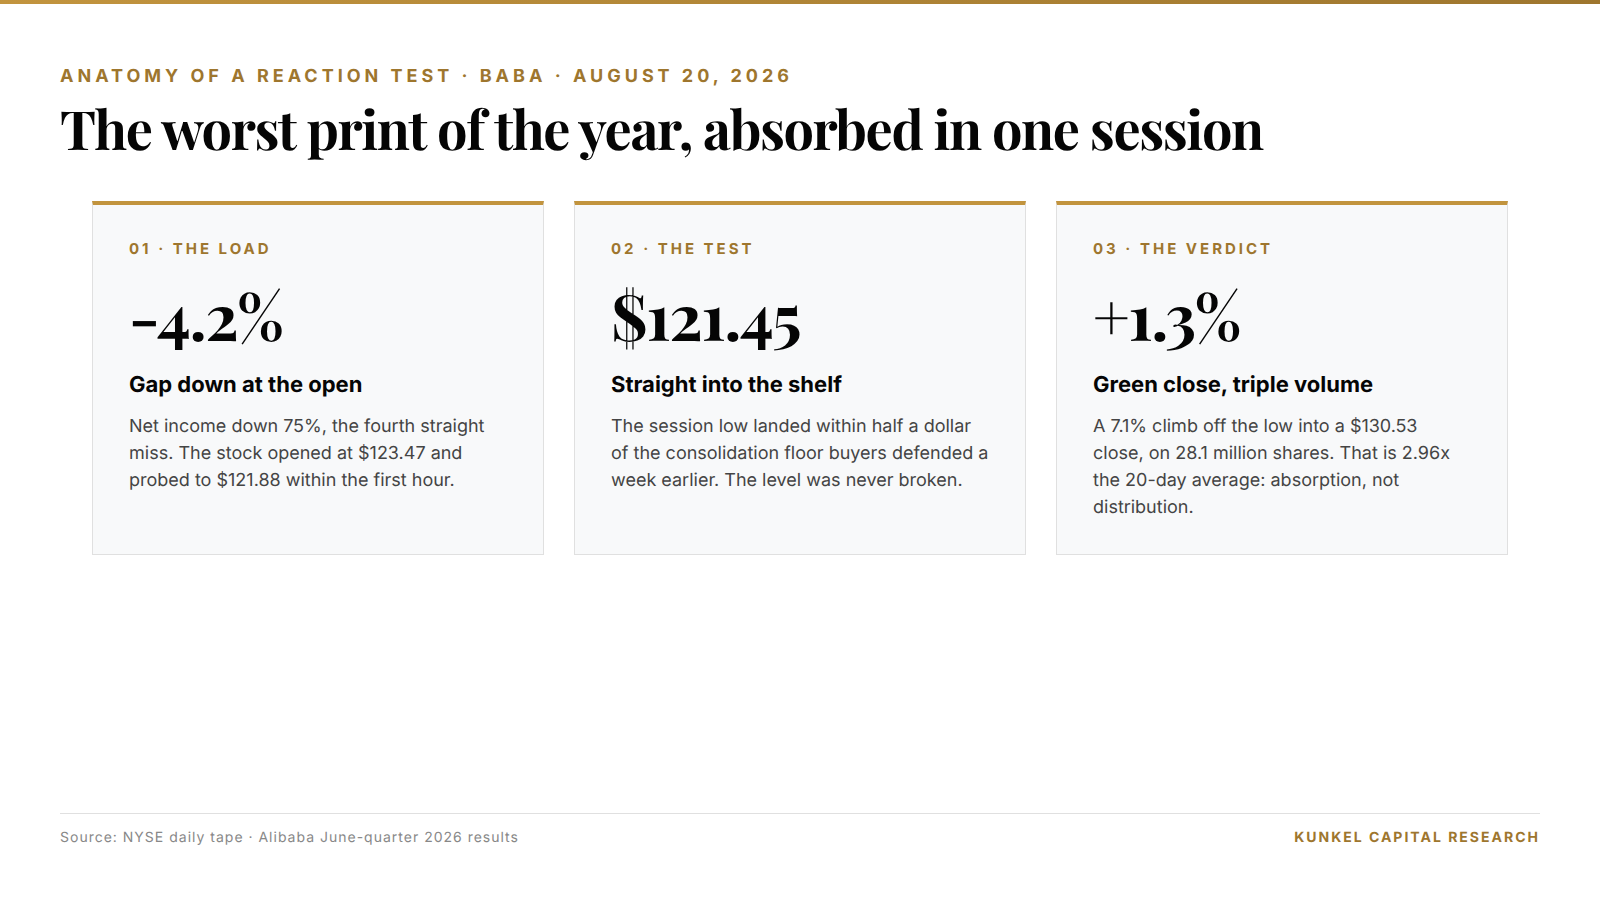
Alibaba reported a 75% collapse in net income before Thursday's open, and the stock finished the day green. That sentence should not work, but the tape wrote it anyway on August 20. The shares gapped down 4.2% at the bell, touched $121.88 within the first hour, and then spent the rest of the session climbing. By the close they sat at $130.53, up 1.3% from Wednesday, on 28.1 million shares traded. Consensus says a company that misses earnings four quarters in a row deserves a lower multiple. For six hours on Thursday, the market disagreed in public.
The setup in 3 lines:
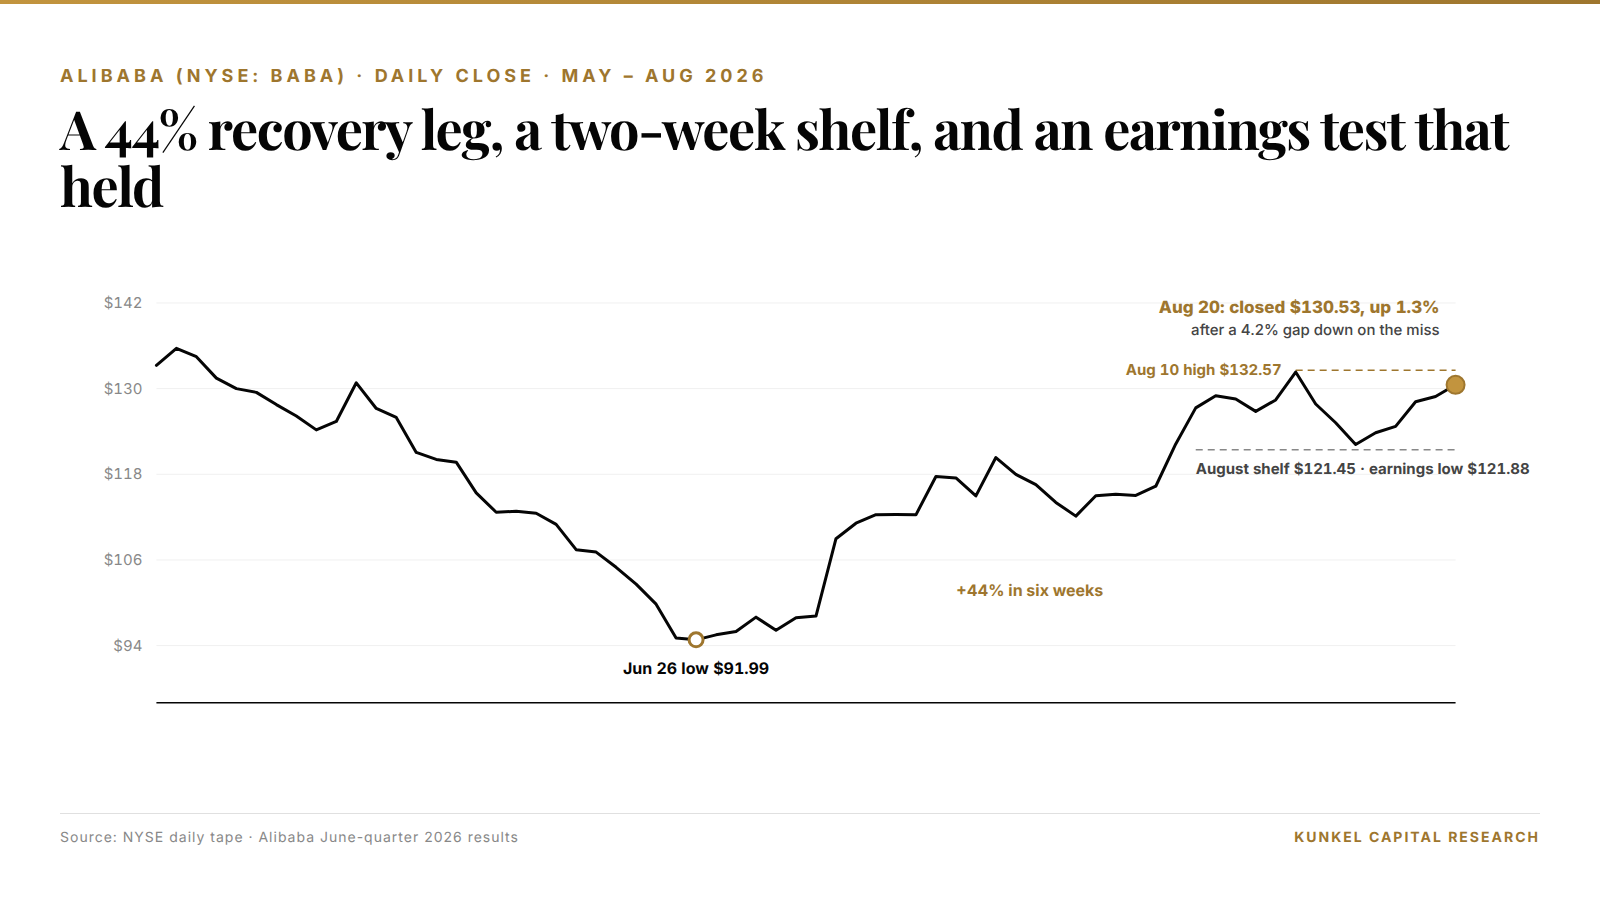
- Alibaba fell 4.2% at Thursday's open on the profit miss, then reversed to close up 1.3% at $130.53 on 28.1 million shares, roughly triple the recent average.
- Bad news that gets bought is information: when a violent headline can't produce a violent close, the sellers the headline should have activated aren't there.
- The bar to watch is the August range: the earnings-day low probed the $121.45 shelf and held, and the recovery high from August 10 sits at $132.57.
Here's the stat that frames everything below. Thursday's volume ran at 2.96 times the 20-day average, the heaviest session since the July rebound began, and price closed in the top tenth of the day's range. Heavy volume with a weak close means distribution. Heavy volume with a strong close after a gap down means someone large spent the whole day buying what the headline shook loose. You don't get to see who. But you get to see the footprint.
Alibaba's miss was the ugliest print of its year, and the candle closed green
Start with what the June-quarter release actually said, because the miss was real and we're not going to soften it. This wasn't a rounding error that algorithms overreacted to. It was the fourth consecutive quarter below the consensus earnings line, and the worst of the four.
The numbers from the company's results filing:
- Revenue came in at RMB 268.95 billion, about $39.6 billion, up 9% from a year earlier.
- Net income fell 75%, crushed by the AI buildout.
- Capital expenditure jumped 75% to RMB 67.68 billion, nearly $10 billion in a single quarter.
- AI Cloud and Compute revenue grew 45% to RMB 48.44 billion, and that growth rate accelerated from the prior quarter.
- AI product revenue reached RMB 12.38 billion, the twelfth consecutive quarter of triple-digit growth.
So the income statement told two stories at once. The bottom line collapsed under capex, while the one segment the whole bull case rests on grew faster than it did last quarter. In plain terms, Alibaba is torching current profit to buy compute, and the compute is selling as fast as they can rack it. The question a trader has to answer isn't whether that's good or bad in the abstract. It's which of those two stories the market is actually pricing, and Thursday's session was a live vote on exactly that.
A reaction test grades the response to news, not the news itself
A reaction test is the practice of judging a trend by how price behaves when hit with news that should hurt it, rather than by the news itself. That's the whole method in one sentence. The idea is older than any indicator on your chart. Markets discount expectations, which means the print matters less than the gap between the print and what holders were braced for.
Think of it like an engineer inspecting a bridge. He doesn't judge it by the paint; he loads it and watches the deflection. Thursday loaded Alibaba with the worst profit number of its year, in front of every holder at once. The deflection was 5.4% at the session low. It snapped back within hours, and the close landed above where the load was applied. A structure that does that isn't telling you it's fragile.
The logic runs on a simple asymmetry. Anyone who wanted to sell Alibaba on deteriorating earnings just received the loudest possible permission slip. The gap even handed them a 4.2% head start. If meaningful supply existed at these prices, that was its moment, and the afternoon would have looked very different. Instead the selling exhausted itself into the $121 handle before lunch, and the bid never let price back down. Which just means the marginal holder had already made peace with the capex number before it printed.
2.96 times average volume, and a close in the top tenth of the range. Distribution doesn't look like that. Absorption does.
We flagged the same mechanism running in reverse in Tesla's post-earnings crash, where a record revenue beat produced a 14.5% collapse. Good news, sold hard, told you the holders were done. Here it's the mirror image: terrible news, bought hard, and the message inverts with it.
The gap-down landed on the August shelf near $121.45 and found no sellers
Location is what upgrades Thursday's candle from interesting to structural, so walk the chart back three months. Alibaba's June capitulation printed $91.99 on June 26, the terminal low of a decline that started at $192.67 last October. From that low the stock ran 44% in six weeks, topping at $132.57 on August 10. Since then it had been consolidating sideways, and the floor of that consolidation formed at $121.45 on August 13.
Now look at where the earnings gap landed. The session low was $121.88, within half a dollar of the shelf that buyers had defended the week before. The market drove price straight into the one level where committed bids were known to live, using the scariest headline available. The shelf held without even being fully tagged. If you've read our piece on Wyckoff springs, you'll recognize the family resemblance: a probe into support on bad news that fails to break it, stranding everyone who sold the hole.
One honest self-correction, though. Our first instinct was to call the bar a spring. Wait, actually, that's too generous: a true spring trades below the range low and reclaims it, and this bar never undercut $121.45 at all. It's a test of the shelf, not a spring beneath it, which is a less dramatic pattern but a cleaner one. Nothing got trapped below; the floor simply refused to give way under maximum load.
The reversal also says something about the larger structure. A 44% advance off a capitulation low, followed by a shallow two-week range that holds its floor under earnings stress, is the signature of a trend in its early innings rather than its late ones. We walked through why shallow reactions matter in Wave 3 extensions, and the same tell applies here: strong trends don't give back much, even when handed a reason to.
Eddie Wu put half of a RMB 380 billion plan on the table in one year
The scene that mattered on Thursday happened on the earnings call, before the US session even opened. CEO Eddie Wu told analysts that Alibaba has already spent roughly half of its RMB 380 billion AI investment plan, about $56 billion earmarked for 2026 through 2029. He added that the company expects the AI spend to reach break-even within three years at current gross margins. That's the stake, stated plainly by the person signing the checks: the profit collapse isn't an accident to be fixed, it's the plan, running ahead of schedule.
And that reframes what the four-quarter miss streak means. Analysts have been modeling an e-commerce company with a cloud attachment, then acting surprised each quarter when management spends like an AI infrastructure company instead. The miss isn't new information anymore; it's the same information arriving for the fourth time. Meanwhile the 45% cloud acceleration and the twelve straight triple-digit AI quarters are the return on that spend showing up in revenue, one segment ahead of the income statement.
Translation: the headline measured the cost of the buildout, the tape priced the buildout itself, and Thursday told you which one the marginal buyer cares about. Alibaba is one of the assets on the Kunkel Capital rotation: members get the full structure map with entry, exit and invalidation refreshed on a fixed cycle.
There's a caveat we can't resolve from public data, and we'd rather name it than pretend otherwise. Some unknowable share of Thursday's bid was short covering into a crowded bearish print rather than fresh accumulation, and positioning data won't separate the two for days. A cover-driven reversal fades faster than an accumulation-driven one. The next test of the shelf, if it comes, settles that argument.
Volume of 28.1 million shares is what separates a reversal from a bounce
Reversal candles print all the time, and most of them mean nothing, so the method needs a filter. Ours is participation. A gap-down reversal on thin volume is noise: a few market makers walking price back up an empty book. The same shape on 2.96 times average volume is a transfer of inventory, because somebody had to take the other side of every panicked sale, in size, all day.
Compare the last three earnings reactions we've covered and the filter sorts them cleanly. TSMC's record quarter got sold 5% in July, a heavy-volume rejection of good news that we read as a fourth-wave pullback. Micron's export-curb rebound ran on expanding volume and kept going. Tesla's beat got dumped on the heaviest tape in a year and kept falling. In every case the reaction carried more forward information than the news, and volume was the part that made the reading trustworthy.
The historical base rate backs the tell, and it's worth stating as a rule you can reuse. When a liquid large-cap gaps down more than 3% on earnings and closes above the prior session's close on at least double average volume, the report's bad news has, by definition, been fully absorbed within one session. After all, everyone who wanted out on that news had their chance at better prices than the close. What remains is a holder base that heard the worst and stayed.
$91.99 to $132.57 in six weeks, then a two-week range that held its floor under a 75% profit collapse. That's the sequence, and it reads like accumulation, not exhaustion.
The structural read, and the condition that would break it
Pull the threads together and the read resolves fully. Alibaba's June low at $91.99 ended the decline from $192.67, and the 44% advance off that low established a new trend with unusual momentum. The August consolidation gave back little of it, which is how strong trends rest, as we showed in Wave 4 pullbacks. Thursday's earnings loaded that resting structure with the ugliest fundamental print of the year, and the structure didn't crack; it closed the day pressing the top of its range instead. Direction of least resistance: up, toward a test of the $132.57 recovery high, with the October $192.67 peak as the multi-month reference above it. The mechanism is a market repricing Alibaba from an e-commerce margin story to an AI compute story, one violent session at a time.
So here is where we are wrong, stated as behavior rather than a price we'd sell you. The thesis breaks if the reaction test gets retaken and fails, meaning a daily close back below the earnings-day low on volume anywhere near Thursday's. That outcome would prove the buyers who absorbed the print got overrun. It would mean the reversal was cover, not accumulation. A quiet drift into the shelf that holds again would do the opposite and confirm it. Until one of those happens, Thursday's candle stands as the most informative bar on the chart.
Frequently asked questions
What is a reaction test in trading?
A reaction test judges a trend by how price responds to news that should hurt it, rather than by the news itself. A strong close after a bearish headline shows the selling pressure the news should have triggered isn't there, which is information the headline can't give you.
Why did Alibaba stock close up after missing earnings on August 20, 2026?
The market chose to price the 45% AI cloud acceleration over the 75% net income drop. The gap-down was bought back within hours on roughly triple average volume, and the stock closed at $130.53, up 1.3%, because the capex-driven miss was already expected by the holders who mattered.
Is the Alibaba earnings miss a sell signal?
The tape said no. A fourth consecutive miss that produces a green close on 28.1 million shares means the bad news was absorbed, not ignored. The signal flips only if the earnings-day low gives way on comparable volume.
What levels matter on the Alibaba chart now?
The market-visible ones below price are the June 26 capitulation low at $91.99, the August consolidation floor near $121.45, and Thursday's session low at $121.88. Above price sit the August 10 recovery high at $132.57 and the October 2025 peak at $192.67. Everything between those is the trend's working room.
Know your entry, your exit, and where you are wrong on Alibaba
Thursday's reaction test is the surface signal. Alibaba is on the Kunkel Capital watchlist: the full research maps the current wave count to a defined entry zone, an exit objective and the exact invalidation level, refreshed on a fixed rotation, with alerts when levels hit. €19.99 first month, then €34.99. Cancel anytime.
Last updated: 2026-08-21