The S&P 500 closed at 7,718.60 on Friday, September 4, 2026, and the number that built its August record no longer exists. July's minus 23,000 payrolls print was revised to plus 21,000 inside Friday's report. That was the print that cut September hike odds from 58% to 42% and carried this index to a record close. A hike-off rally is a stock advance powered by falling rate-hike odds rather than by improving growth, and that was our published read on the August high. So here is the scorecard, misses included.
The setup in 3 lines:
- July payrolls were revised from minus 23,000 to plus 21,000, and June went up 11,000 to plus 31,000.
- September hike odds ran 58% to 42% and back to 58% in 28 days, a complete round trip.
- Gold lost 1.28% on Friday's print while the S&P 500 lost 0.38%, and that spread is the verdict on the call.
At 8:30 a.m. Eastern on Friday, the Bureau of Labor Statistics reported 162,000 August jobs against a consensus near 53,000. Traders lifted September hike odds by roughly nine points to 58% on CME FedWatch within the hour. That put the rate engine of the August record exactly back where it started.
July's minus 23,000 became plus 21,000, and the call's founding number vanished
Start with the revision, because everything else follows from it. Buried under the headline beat, the same BLS release moved June up 11,000 to plus 31,000 and July up 44,000 to plus 21,000. Combined, those two months now stand 55,000 jobs higher than the tape believed on August 7. The economy that looked like it was shedding workers had been adding them the whole time.
We wrote the original piece on August 10, when the record close landed on a negative payrolls print. The thesis was that the rally ran on the Fed being boxed out of hiking, not on growth. And we flagged the measurement risk in the piece itself: payroll prints get revised twice, and single negative months have been false alarms before.
That caveat ended up doing the heavy lifting. Because the print was an artifact, the "economy rolling over" branch of the read never had to be traded. Think of the payrolls series as a fuel gauge that only settles two months after the flight. You can fly on the first reading, but you shouldn't bet the landing on it.
Translation: the scary number that drove the August record got quietly deleted, and the index barely noticed either time.
September hike odds ran 58% to 42% and back to 58% in 28 days
Thursday set the trap before Friday sprung it. Speaking at a Reuters-hosted event on September 3, Fed Governor Christopher Waller said his September vote would be "heavily influenced" by the August inflation data due next week. He'd hold if progress continued, and he'd consider a hike if inflation came in hot. Traders heard the first half, cut September hike odds from roughly 63% to about 50%, and bought everything.
The tape that afternoon was unusually clean. The S&P 500 rose 1.06% to close at 7,747.71, back within striking distance of the August record, and gold futures jumped nearly 3%. So the market went into Friday's print leaning dovish, which is the setup that makes a beat hurt.
Then 162,000 landed. The 10-year Treasury yield pushed to 4.78%, and the 2-year hit its highest level since January 2025. That front-end move is the one that prices the meeting, a mechanic we walked through in the 2-year yield's hike pivot. Odds finished at 58%, the same number that stood the night before the July print. A full round trip in four weeks. The index sits within half a percent of where it began, with the funds rate still at 3.50-3.75% into the September 15-16 meeting.
58% to 42% to 58%. The rate engine of the August record made a complete round trip, and the S&P 500 gave back 0.5%.
Gold surrendered 1.28% while the index surrendered 0.38%, and the spread is the proof
Friday ran the August experiment backwards, which is the cleanest test any thesis gets. In August, stocks, gold and Treasuries all rallied on the same jobs number. We argued that mix could only mean one thing: a discount-rate rally, where a lower expected path of rates marks up every long-duration asset at once. If that read was right, a hawkish print should hit the assets with no growth engine hardest, and Friday was that print.
That is close to exactly what happened. Spot gold slid about 1.28% to roughly $4,420 after futures had traded as high as 4,537.80 in the same session, a $125 swing top to bottom. Bitcoin came off Thursday's 81,272 to 79,672, another rejection near the ceiling we mapped when bitcoin failed at the 50-week average. Silver was the one holdout at $66.75, keeping most of Thursday's jump while gold and bitcoin handed theirs back.
The S&P 500, by contrast, lost 0.38%. The Nasdaq lost 0.29%, and the VIX closed at 14.53, which is not the reading of a market that thinks it just lost its support. Equities got the same hawkish repricing as gold and paid roughly a quarter of the bill.
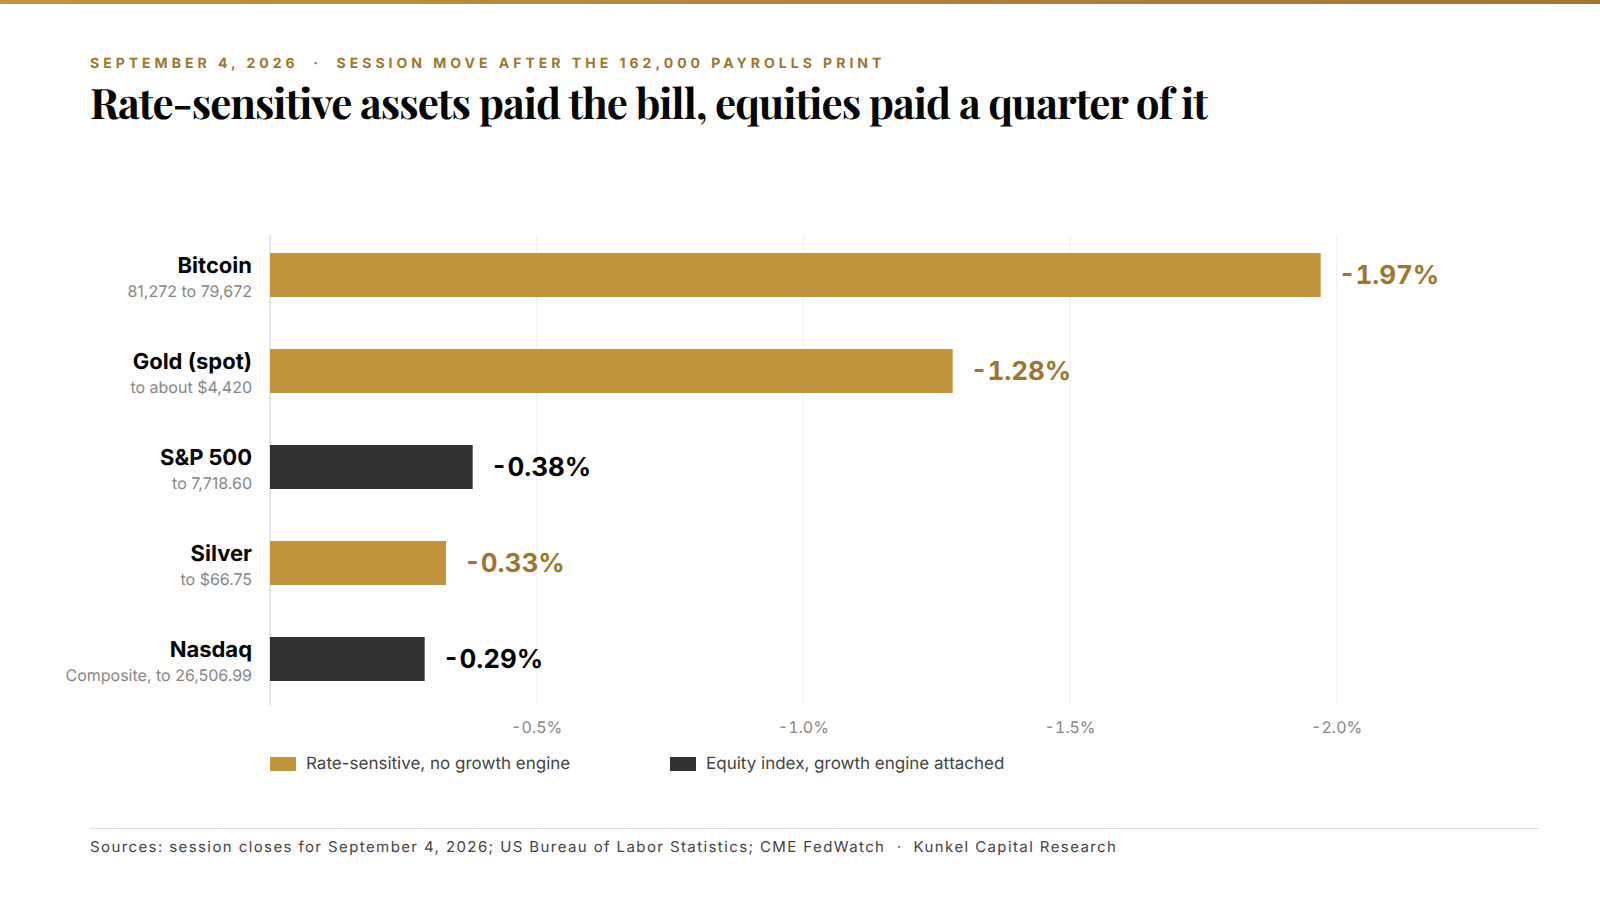
In plain terms, the discount-rate read was right about the mechanism and the ranking. Gold, silver and bitcoin behaved as a rate-driven complex should when the rate story flips. It's the same behavior we traced in gold's rally into the Hormuz deal and in silver's post-payrolls breakout. Stocks broke the pattern, and that break matters.
The invalidation we published half-fired, and the price leg never came close
Our August piece named the condition in plain language. A weekly close back under the low-7,500s, the area where the breakout week began, while September hike odds rebuild above 50%. Both legs of that condition had to fire. Only one did.
The odds leg cleared easily at 58%. The price leg of it never got tested. The index hasn't been near the low 7,500s since, and the origin of that breakout week was the 7,504.78 low on August 3. The deepest pullback since came on September 1, at 7,611.20, more than a percent above it. Nothing in four weeks has threatened that floor.
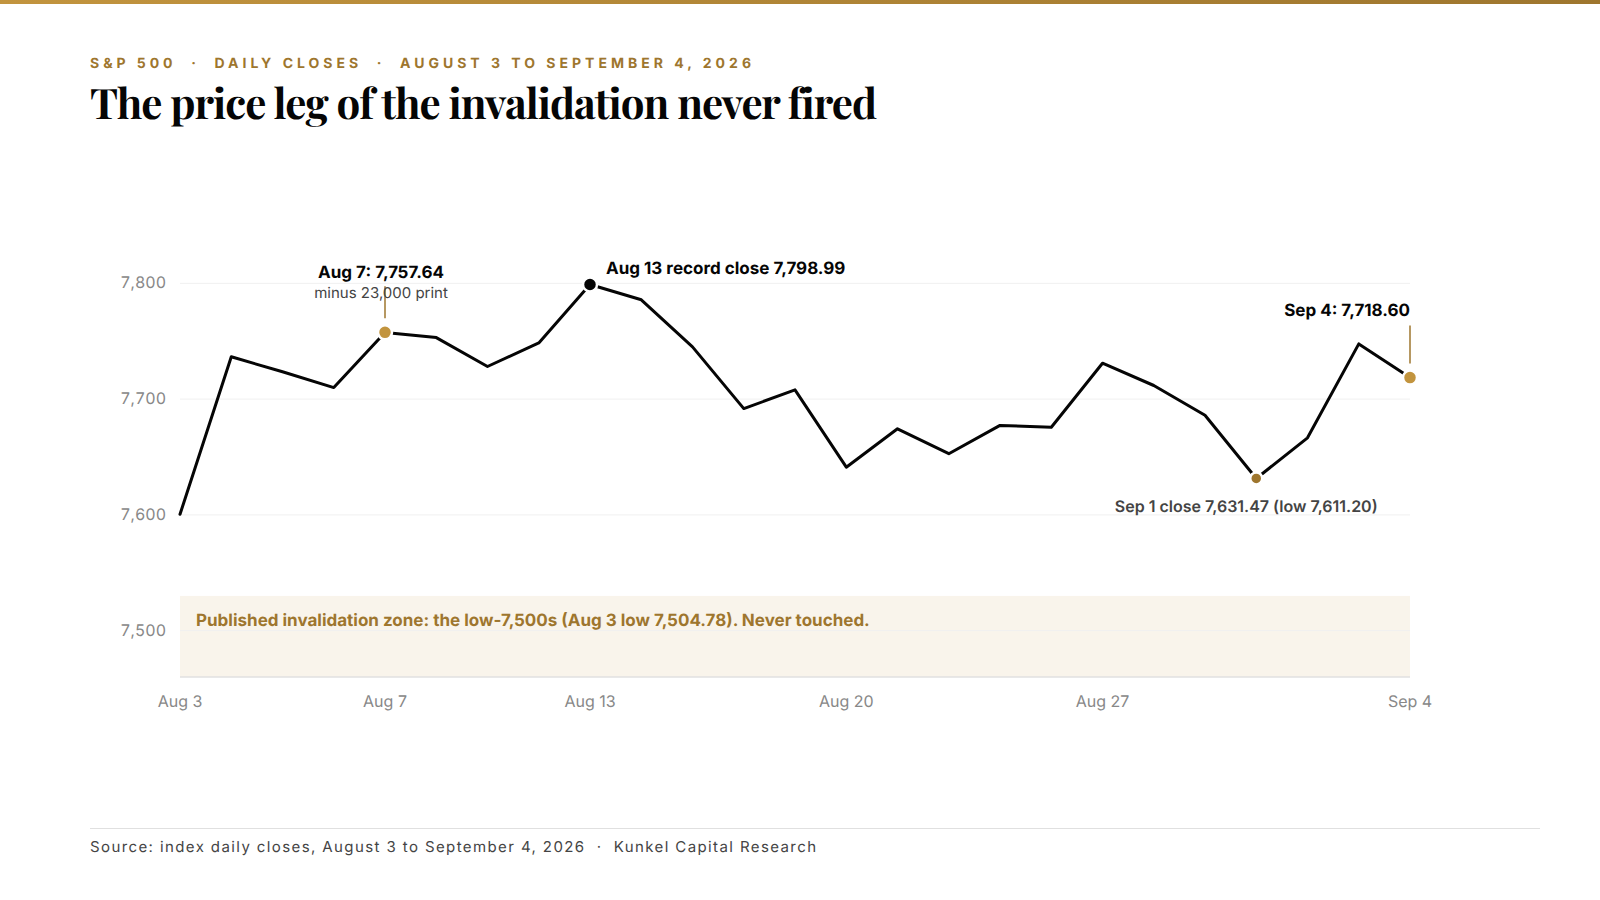
If you tracked only the headline odds this month, you missed that the price leg never fired at all. We ran the same scorecard exercise when the Nasdaq 100 top call resolved.
Here is the scorecard on the August 10 read, marked honestly.
- Mechanism call (discount-rate rally, not growth): correct, confirmed in reverse on September 4.
- Cross-asset ranking (rate-sensitives hit hardest on a hawkish flip): correct, gold 1.28% versus stocks 0.38%.
- Revision risk on the minus 23,000 print: flagged in the piece, and it landed at plus 21,000.
- "Growth engine may be running in reverse": wrong, and the revision is what proves it wrong.
- Published invalidation: half-fired, odds above 50%, price never reached the low-7,500s. Read intact.
- Net index change since the August 7 record close of 7,757.64: minus 0.5% in four weeks.
The S&P 500 is one of the assets on the Kunkel Capital rotation: members get the full structure map with entry, exit and invalidation refreshed on a fixed cycle.
What we got wrong: the second engine was never actually off
We described the index in August as a twin-engine plane flying on one engine, with the growth engine possibly running in reverse. That image was half right, and the wrong half matters. The rate engine did quit on Friday, right on cue. The plane didn't descend, because the second engine had been running the whole time and only the instrument panel said otherwise.
Look at what August actually delivered underneath the headline. Average hourly earnings rose 0.3% to $37.75, up 3.1% over the year, and the average workweek edged up to 34.4 hours. Firms adding hours and paying more are not firms bracing for a contraction. And 162,000 was the strongest month since March, which is a strange thing to find in an economy we had described as possibly shrinking.
Wait, actually, there's a fairer way to put our error. The mechanism read never depended on the growth call, so the trade of the thesis held up. But the framing did depend on it, and the framing is what a reader carries around for a month. We leaned on one unrevised data point to describe the whole economy, and it wasn't strong enough to carry that weight.
The same caution now applies in the other direction. August's 162,000 gets revised twice as well, so the strong print deserves the same discount we should have applied to the weak one.
$37.75 and 34.4 hours. Wages up, hours up, and we called the growth engine possibly reversed.
August CPI next week decides whether Friday was a scare or a repricing
Everything from here runs through a single release. Waller said it outright on Thursday: the September decision hinges on the August inflation data. July CPI had already cooled to 3.4% from 3.5%, with core inflation at 2.5%, and the August print either confirms that trend or ends it. So the hike bet that Friday rebuilt is provisional, and it stays provisional until that print lands ahead of the September 15-16 meeting.
The structural read that follows is simple. The advance off the early-August base is intact, and the record close of 7,798.99 from August 13 is still the high-water mark. Four weeks of chop under it reads as consolidation, not distribution, as long as the September 1 low at 7,611.20 holds. What changed since August isn't the direction but the reason. The index now has a growth argument it didn't appear to have a month ago, and that argument outlasts a rate reprieve because it comes from earnings rather than from the discount rate.
A hot CPI is the obvious risk, since it would put a live hike into a market already sitting near its highs. Even so, the August evidence says the equity tape can absorb a hawkish repricing at a fraction of what gold pays for the same news. That is a different market from the one we described on August 10, and it is a better one for equity holders.
Here is where the thesis breaks now. Watch the pairing rather than any single print: a weekly close back under the September 1 low while hike odds hold above 50% and gold keeps sliding. That combination would mean equities finally started paying gold's price for the repricing. We'd read the four-week range as a top. Until that happens, the burden of proof still sits with the bears, and the growth engine is what carries it.
FAQ: the hike-off call and the payrolls revision
Was the S&P 500 hike-off call wrong?
The mechanism call was right and the growth framing was wrong. Friday's hawkish print hit rate-sensitive assets hardest, exactly as a discount-rate read predicts. But the July revision from minus 23,000 to plus 21,000 removed the basis for calling the growth engine stalled.
Why did stocks fall so little when hike odds jumped to 58%?
Because the same report that revived the hike bet also delivered 162,000 jobs, rising wages and a longer workweek. Higher rates hurt valuations while stronger growth helps earnings. On Friday the two roughly offset for equities, and gold got only the rate half.
How much do payroll numbers usually get revised?
Enough to change a story. In this release June moved up 11,000 and July moved up 44,000, flipping a negative month into a positive one. Every print is revised twice in the two months that follow, which is why single months make poor foundations.
What happens to the S&P 500 if the Fed hikes in September?
That depends on the August CPI print that comes first. A hike into firming payrolls is a different event from a hike into a stalling economy. Friday's evidence says this tape can absorb the rate half when the growth half improves.
Know your entry, your exit, and where you are wrong on the S&P 500
The payrolls revision is the surface signal. The S&P 500 is on the Kunkel Capital watchlist: the full research maps the current wave count to a defined entry zone, an exit target and the exact invalidation level. Levels refresh on a fixed rotation, with alerts when they hit. €19.99 first month, then €34.99. Cancel anytime.
Sources: US Bureau of Labor Statistics, Employment Situation for August 2026, released September 4, 2026. Also CME FedWatch, Reuters coverage of Governor Waller's September 3 remarks, and Bloomberg session data. This is market commentary, not investment advice.
Last updated: 2026-09-06