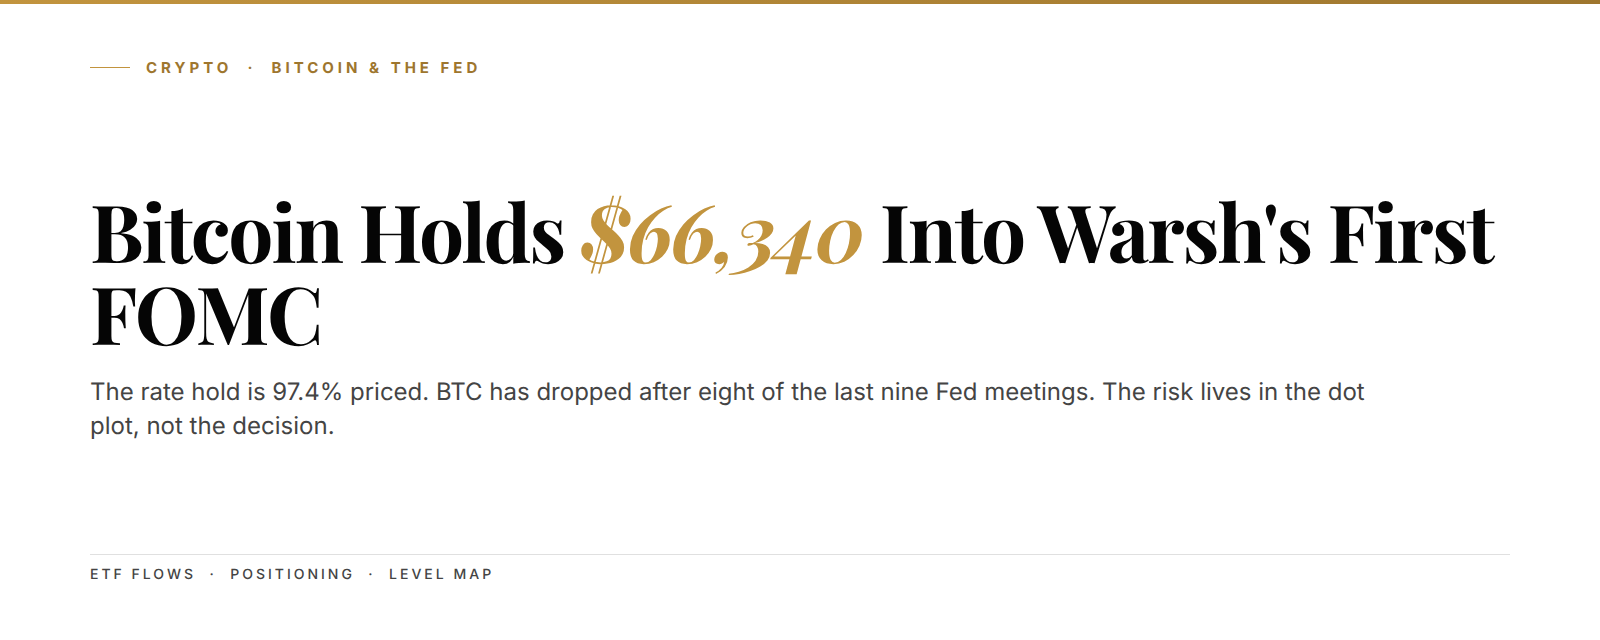
Bitcoin sat at $66,340 on Tuesday, June 16, the day Kevin Warsh gaveled open his first meeting as Fed Chair. The screen looks calm. It isn't. Bitcoin has fallen after eight of the last nine Fed meetings, and the average drop the following week ran near 11%. A rate hold is 97.4% priced into futures. So the decision isn't the risk. Warsh's tone is. One hawkish line about the 4.2% CPI print, and the $64,000 shelf gets tested before Thursday's close.
The setup in 3 lines:
- Bitcoin holds $66,340 into a two-day FOMC that a 97.4% majority expects to leave rates at 3.50% to 3.75%.
- The risk isn't the decision. It's Warsh's first dot plot (the chart where each Fed official marks their rate forecast) and his read on 4.2% inflation.
- History says BTC drops near 11% the week after a Fed meeting. The $64,000 shelf is the first line. $59,130 is the low that already held.
Here's the part the calm screen hides. On June 11, a single block crossed the tape: 29.2 million shares of BlackRock's IBIT at roughly $43 each, a $1.29 billion dark-pool sale. That's one of the largest institutional exits from the fund ever recorded. It printed quietly, off the main exchange, while retail watched the $66,000 handle hold. The big money was already moving before Warsh reached the podium.
Warsh's first dot plot, not the rate hold, is the only number that moves Bitcoin this week
The rate decision is a non-event. CME futures put a hold at 97.4%, keeping the band at 3.50% to 3.75%. Markets don't move on what they already know. They move on what changes.
What changes Wednesday is the dot plot and the tone. Warsh is new in the chair. Traders have no read on how he frames a hot inflation print. May CPI came in at 4.2%, above the 4.0% the desk wanted. A Chair who leans on that number signals fewer cuts ahead. Fewer cuts means a stronger dollar and tighter money. Both pull capital out of risk assets like Bitcoin.
Think of the dot plot like a weather forecast read aloud by a new meteorologist. The storm map is the same. But nobody knows yet whether this one calls for caution or calm. The market has to learn his voice in real time, and it learns by selling first and asking later.
Translation: the rate is set. The only thing that can shock Bitcoin this week is whether Warsh sounds worried about inflation or relaxed about it.
97.4% priced. When the decision is that certain, the price reaction lives entirely in the forward guidance, not the number itself.
Bitcoin's record $3.4 billion ETF outflow week says institutions already de-risked
Spot Bitcoin ETFs bled $3.4 billion in a single week in early June. That's the biggest weekly exit since the products launched in January 2024. The selling didn't start in June. It began in mid-May and rolled downhill for three straight weeks.

This matters more than the price chart. ETF flows are the cleanest read on institutional demand we have. When BlackRock, Fidelity, and the rest see net redemptions, it means pensions, RIAs, and funds are pulling chips off the table. They moved before the Fed meeting, not after.
Why does that flip the usual fear logic? Because the de-risking is mostly done. A market that already sold $3.4 billion has less left to puke. The marginal seller thins out. That's the quiet setup hiding under a fearful tape. As of June 16, the Fear and Greed Index sat at 23, still deep in fear, even after Bitcoin clawed back from $59,130 to $66,340.
Translation: the crowd already sold. The people who panic at Fed meetings mostly panicked in May. There's less fuel left for another flush.
You can see the same divergence in our read on how Bitcoin's plunge below pre-war levels flipped its correlation regime back to a pure risk asset. When BTC trades like a Nasdaq future, Fed days hit harder. That's the regime we're in now.
IBIT's $980 million worst-week ever was profit-taking from $52,000 buyers, not panic
BlackRock's IBIT lost $980 million in that record week. Its worst stretch on record. The fund also took the single largest one-day hit in the category, $448 million in one session, and absorbed that $1.29 billion dark-pool block on June 11.
Here's the part that reframes the whole story. Many of those institutional positions were built in the $52,000 to $58,000 range during the first quarter of 2026. Sell at $66,000, and you're locking a clean 15% to 25% gain. That's not a fire sale. That's a desk taking profit into strength, on schedule, ahead of an uncertain Fed event.
Think of it like a landlord who bought a building cheap and sells half his units after a renovation bumps the value. He's not fleeing the neighborhood. He's harvesting the markup and keeping the rest. The Q1 buyers are doing the same thing with their Bitcoin stack.
Wait, actually, one number complicates the clean read. The $1.29 billion block printed near $43 a share, well below IBIT's price during the $66,000 spot rally. So at least part of that exit was a holder who bought higher and bailed flat or slightly red. Not every seller is sitting on a 25% win. Some just wanted out before Warsh spoke.
$52,000 to $58,000. That's where the Q1 institutional cost basis sits. At $66,340, most of the ETF selling is profit-taking, not capitulation.
Ethereum's 17-day outflow streak set the record Bitcoin avoided
Ethereum carried the heavier load. Spot ETH ETFs ran 17 straight days of outflows, the longest redemption streak of any crypto ETF on record. The run finally broke when BlackRock's ETHA took in $19.3 million in a single day. One fund, one green print, after seventeen red ones.
The damage was real. May ETH ETF outflows hit roughly $401 million, the worst month since the products launched. ETH spent mid-June pinned between $1,720 and $1,815, sitting just above a long-term support shelf near $1,500 to $1,600. A wave of token unlocks worth more than $670 million is also hitting the market this week, June 15 to 21, adding fresh supply to a tape already short on buyers.
So why does Ethereum's pain matter for a Bitcoin post? Because it marks the rotation. Money didn't just leave crypto. Inside crypto, it left ETH faster than BTC. Bitcoin's outflows were brutal but never set the streak record. Ether did. That tells you where the conviction drained first.
Translation: when investors get scared, they sell the riskier coin harder. Ethereum is that coin right now. Bitcoin held up better, and that relative strength is a tell.
Here are the five flow facts that frame this week, ranked by what actually moves price:
- $3.4 billion left Bitcoin ETFs in one record week, the largest since January 2024.
- $980 million of that was IBIT alone, its worst week ever.
- 17 straight days of ETH outflows set the all-time crypto-ETF streak record.
- $401 million flowed out of ETH funds in May, their worst month on record.
- $0.8 billion in margin bets got liquidated as Bitcoin fell to $59,130.
The 8-of-9 FOMC drop pattern points at $64,000 first, $59,130 as the floor
The history is hard to ignore. Bitcoin has dropped after eight of the last nine Fed meetings, with the average decline near 11% in the following week. Take June's $66,340 and apply that, and you land near $59,000, right on the low that already held.
But patterns aren't promises. That 11% average was built mostly in 2024 and 2025, when Bitcoin still rode a strong inflow regime and every Fed day met an overheated market. This time the market arrives pre-flushed. The $3.4 billion already left. Positioning is light. A tired seller hits harder in a crowded market, not an empty one.
So the read splits two ways. A hawkish Warsh, leaning on 4.2% inflation, likely sends BTC back through $64,000 toward the $59,130 low. A neutral or dovish lean, signaling the rate path holds steady, could push Bitcoin through $67,000 toward $68,000. The shelf at $64,000 is the line that decides which tape you wake up to Thursday.

We're honest about the uncertainty here. Nobody has a read on Warsh's voice yet, and the first meeting of a new Chair is the single hardest Fed event to forecast. The structural setup leans constructive. The event risk is real. Both things are true at once.
8 of 9. Bitcoin fell after eight of the last nine Fed meetings. The average drop ran 11%. This time, the market arrives already sold.
What we're watching after Warsh speaks: the positional read
The plan is simple, and it hangs on one level. $64,000 is the pivot. Hold it through Warsh's press conference, and the pre-flushed setup plays out: thin sellers, a fearful crowd at 23 on the index, and room to drift back toward $68,000. Lose it on a hawkish tone, and the $59,130 floor comes back into play fast.
Watch three things in order. First, the dot plot: more than one cut penciled for 2026 reads dovish, zero reads hawkish. Second, Warsh's exact words on the 4.2% CPI print. Third, the ETF flow data the morning after, which tells you whether institutions bought the reaction or sold it.
Most traders will watch the rate decision and miss the entire move. The rate is a non-event. The move lives in the guidance and the flows. That's the entire game this week.
Our broader macro read connects here too. The same tightening impulse shows up in how the two-year Treasury yield spiked after May's payroll print and in how consumer sentiment jumped to 48.9 while inflation bets cooled ahead of this very meeting. Bitcoin doesn't trade in a vacuum. It trades the dollar, the yield, and the Fed's voice.
Frequently asked questions
Why does the Fed meeting matter for Bitcoin if a rate hold is already priced in?
Because the rate isn't the news. The forward guidance is. The dot plot and Warsh's tone on 4.2% inflation tell the market how many cuts to expect next. Fewer cuts mean a stronger dollar, which pulls money out of Bitcoin. A 97.4% priced hold means all the price action lives in the guidance, not the number.
Is the $3.4 billion ETF outflow a sell signal for Bitcoin?
Not on its own. Record outflows often mean the de-risking is mostly finished, not starting. Much of the IBIT selling was profit-taking from buyers who entered at $52,000 to $58,000 in Q1. A pre-flushed market has fewer sellers left, which can set up a bounce rather than a deeper drop.
What price levels matter for Bitcoin this week?
The $64,000 shelf is the first pivot. Hold it through Warsh's press conference, and the path opens toward $67,000 and $68,000. Lose it on a hawkish tone, and the $59,130 low comes back into play. That low already held once during the June flush.
Why did Ethereum fall harder than Bitcoin?
ETH ETFs ran 17 straight outflow days, a record, while Bitcoin never set that streak. Investors sell the riskier asset first when fear rises. A $670 million token-unlock wave hitting June 15 to 21 added fresh supply to a tape already short on buyers.
The surface signal is the $66,340 hold into Warsh's first meeting. The deeper read is positioning, flows, and the level that decides the week.
See the full Bitcoin FOMC setup
The $66,340 hold into Warsh's first meeting is the surface signal. The Kunkel Capital research adds the full positional map: the exact invalidation level below $64,000, the sized re-entry zone if $59,130 gets retested, the dot-plot scenarios mapped to BTC targets, and the ETF-flow dashboard we watch every morning. €19.99 first month, then €34.99. Cancel anytime.
Last updated: 2026-06-17