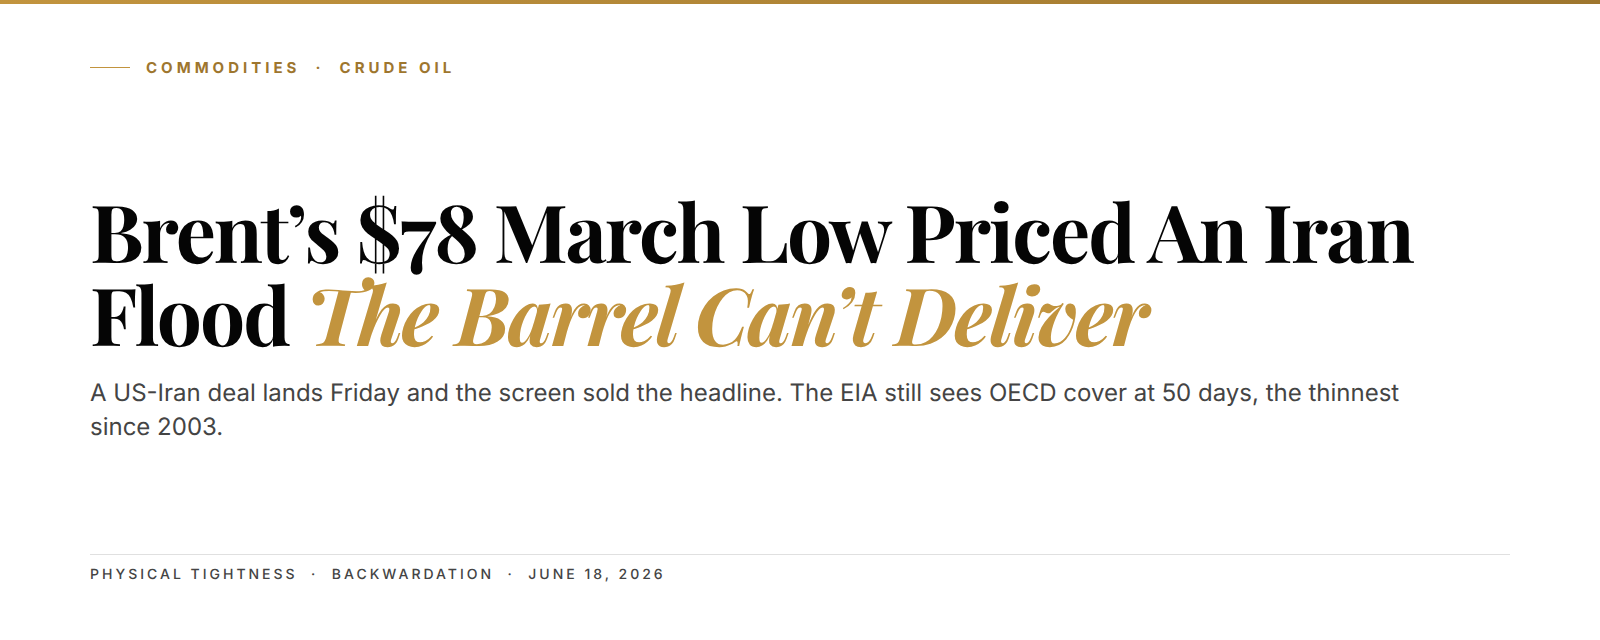
Brent crude fell to $78 a barrel on Wednesday, June 17, 2026, its fifth straight losing session and the lowest screen price since early March. The tape screams glut. A US-Iran deal gets signed in Switzerland on Friday. Sanctions lift. Roughly two million barrels a day of Iranian crude walks back toward the market. That's the trade every desk piled into this week. Here's what the screen is missing. The physical barrel is the tightest it has been in twenty-three years.
---
The setup in 3 lines:
- Brent printed $78 on June 17, a March low, pricing in roughly 2 million barrels a day of returning Iranian supply.
- The EIA's June outlook has global inventories drawing 6.3 million barrels a day this quarter, with OECD cover at 50 days by year-end, the thinnest since January 2003.
- The screen sells the headline. The curve still pays you to hold the physical barrel. Watch the front-month spread, not the flat price.
TankerTrackers, the maritime intelligence firm, logged 3.8 million barrels leaving the Strait of Hormuz this week. That was Iran's first real export run in months. Sounds like the flood already started. It hasn't. Those barrels came off floating storage, tankers that sat full through the blockade. That's old oil clearing, not new production. And the difference is the whole trade.
Brent's fifth straight down session priced a flood that has not landed
Brent lost ground every day this week into Wednesday's $78 print. The selling reads clean on a screen. Peace deal, sanctions off, more oil, lower price. So the flat price faded toward the March low and stopped pretending the war premium mattered.
But the flat price is the dumbest number on the screen. It tells you what one barrel costs today. It tells you nothing about whether a refiner in Rotterdam can actually source that barrel next month. This week, those two questions split hard.
The selloff front-ran a supply event that has not happened yet. The MOU is electronically initialled, sure. Friday is the formal signing. Even then, the waiver on banking, shipping, and insurance has to clear before a single new cargo loads. That's the gap between a headline and a delivered barrel.
Translation: the market sold the press release. The oil itself is still weeks out.

Iran's 2 million barrels is a headline number, not a delivered one
Iran's ceiling is roughly 2 million barrels a day, about a third above its pre-conflict run rate, per energy-consultancy estimates. That is the number on every front page. It is also the number that will not show up for a while.
Start with the storage overhang. The 3.8 million barrels Iran moved this week were floating-storage tankers, crude that already existed and just got stuck. Clearing that backlog is the easy part. Restarting shut-in wellhead production is slower, and the deal makes it slower still.
Here is the clause the tape skipped. The arrangement is performance-based. Iran gets the benefits only if it keeps to terms: no weapon, enriched uranium neutralised, free passage through Hormuz. Miss a step and the waiver can snap back. No buyer signs a long-haul term contract against a flow that can vanish on a compliance dispute.
Wait. We said two million barrels. Be honest about what that means. It is the theoretical top, reached over quarters, not the volume hitting tankers in July.
2 million barrels a day is the ceiling. The first real cargoes are floating storage, not fresh production, and the deal can snap back on any breach.
The EIA's 50-day OECD cover is the number the screen ignored this week
The EIA's June Short-Term Energy Outlook is not a bullish document by design. It still lands bullish on the physical barrel. Global oil inventories are drawing an average of 6.3 million barrels a day this quarter. That is a fast, hard drain.
The cover number is the one that should stop you. OECD commercial inventories fall to about 50 days of forward demand by the end of 2026. That is the thinnest buffer since January 2003.

Days of cover is just the inventory tank divided by daily use, how long the system runs if supply blinks.
Translation: the world is running on fumes in the tank, even with a peace deal on the wire. The EIA models Brent near $105 through June and July while Hormuz stays choppy, then easing toward $79 in 2027 once flows fully normalise. Read the order there. The tightness is now. The relief is next year.
So the screen and the official outlook tell opposite stories this week. One sells a 2026 flood. The other prints a 2026 drain. They cannot both be right, and the curve has already cast its vote. We walked through this same paper-versus-physical split when the war premium first cracked, in our Hormuz war-premium fade audit.
A Rotterdam refiner is the actor the screen keeps forgetting
Picture the desk that actually has to buy oil. A Trafigura trader sourcing crude for a Rotterdam refinery this week does not trade the Brent flat price. She trades the barrel she can lift in July. And this week she still has to pay up for prompt cargoes, peace deal or not.
That is the disconnect in one scene. The flat price says relax, supply is coming. The buyer in the physical market says the opposite with her bid. She is the one number that cannot lie, because she has a refinery to feed.
Translation: the people who handle real barrels are still scrambling for them. The people who trade screens are selling. Trust the barrel over the headline.
OPEC+ added 188,000 barrels while the UAE walked out the door
OPEC+ raised output by 188,000 barrels a day this month. On paper, more supply. In context, a rounding error against a 6.3 million barrel daily draw. The group added a teaspoon to a draining bath.
The bigger structural shift is the UAE. It left the cartel during the conflict and is now pumping to its own schedule. That sounds bearish, more barrels off-quota. It is also a warning. Spare capacity is concentrating in fewer hands, and the buffer the market leans on is thinner than the membership table suggests.
We mapped that concentration risk when the UAE first broke ranks, in our crude spare-capacity breakdown. The short version: headline OPEC+ supply growth and real, deliverable spare capacity are drifting apart. The screen tracks the first. The physical market trades the second.
Translation: a few hundred thousand barrels of quota tinkering does not refill a tank losing millions a day.
Backwardation is the tell, and the curve still pays to hold crude now
Here is the cleanest signal in the whole complex. The Brent curve is backwardated. Backwardation means near-dated barrels cost more than later-dated ones, so the market is paying a premium for oil right now versus oil in six months.
Think of it like a wheat farmer. If buyers fight over this season's grain and shrug at next season's, today's price sits above the forward price. That is the market telling you the shortage is in the front, not the future. A glut does the opposite. A glut pushes the front cheap and stacks the premium out in time, which is called contango.
If a real Iranian flood were imminent, the front of the Brent curve would be cracking first. It is not. The flat price fell this week, but the front-month spread, the gap between the nearest two contracts, has held its backwardation. That is physical buyers quietly refusing to let go of prompt barrels even as paper sellers hammer the screen. We unpacked the same divergence in detail in our Brent backwardation read.
That spread is the entire game most traders never look at.
The positional read: fade the flat-price panic, respect the front spread
So how do you trade a screen that disagrees with the barrel? You separate the two clocks. The flat price runs on headlines and can stay noisy through Friday's signing and the Fed decision. The structural draw runs on inventories and days of cover, and that clock is not slowing.
Our read, as of June 18, 2026: the flat-price selloff is a sentiment flush, not a supply event. The risk is a knee-jerk gap lower on the signing headline, then a grind back as physical buyers chase prompt barrels into a 50-day cover backdrop. The trade is in the curve shape and the front spread, not in guessing the exact bottom tick on flat price.
That is also where a public post has to stop. The signal here is the mismatch. The position, the sized entry, the spread structure, and the invalidation level live in the full research, because that is the part worth paying for.
You came for the why. The how is the work.
Five things we are tracking into the Friday signing
- The front-month Brent spread. If backwardation holds through the signing, physical tightness is winning. If it flips toward contango, the flood is real.
- Iran's loading data, not its rhetoric. Watch new wellhead cargoes versus floating-storage clearance. Only the first changes the balance.
- OECD days of cover. The EIA's 50-day figure is the structural floor under the whole complex into year-end.
- OPEC+ compliance. The UAE off-quota run tells you how much real spare capacity is left, not the headline quota.
- The Fed print today. A steady rate decision keeps the dollar range-bound, which removes one excuse for crude weakness.
This is the same paper-versus-physical framework we ran on the draw streak in our crude draw-streak note, and it travels across the complex. We see the identical screen-versus-barrel tension in copper, mapped in our COMEX-LME squeeze piece, and in the energy shoulder-season setup in our natural gas low note. Gold is running its own version of it, where the bid is structural rather than headline, covered in our central-bank bid breakdown.
Frequently asked questions
Why did Brent fall this week if oil is physically tight?
Brent fell because the screen prices headlines first. The US-Iran signing on Friday promises roughly 2 million barrels a day of returning supply, so the flat price faded to a March low. The physical market, measured by inventories and the curve, has not loosened yet.
What does backwardation tell me about oil right now?
Backwardation means nearby barrels cost more than later ones. It is the market paying up for oil today versus oil in six months. That only happens when buyers are scrambling for prompt supply, which is the opposite of a glut.
How much Iranian oil is actually coming back?
The ceiling is about 2 million barrels a day, reached over quarters, not weeks. The first cargoes this week were floating storage, old oil clearing, not new production. The deal is performance-based, so flows can snap back on any breach.
What is OECD days of cover and why does 50 matter?
Days of cover is inventory divided by daily demand, how long the system runs if supply stops. The EIA sees OECD cover hitting 50 days by year-end, the lowest since January 2003. That is a very thin safety margin.
Is this a buy signal for crude?
This post flags the mismatch, not a trade. The flat-price panic looks like sentiment, while the curve says physical is tight. The sized entry and risk level sit in the full Kunkel Capital research.
See the full Brent physical-tightness setup
The $78 print and the Friday signing are the surface signal. The Kunkel Capital research adds the front-spread map, the curve-shape triggers, the OECD-cover backdrop, and the sized entry with its invalidation level, the part a public post can't give away. €19.99 first month, then €34.99. Cancel anytime.
Last updated: 2026-06-18