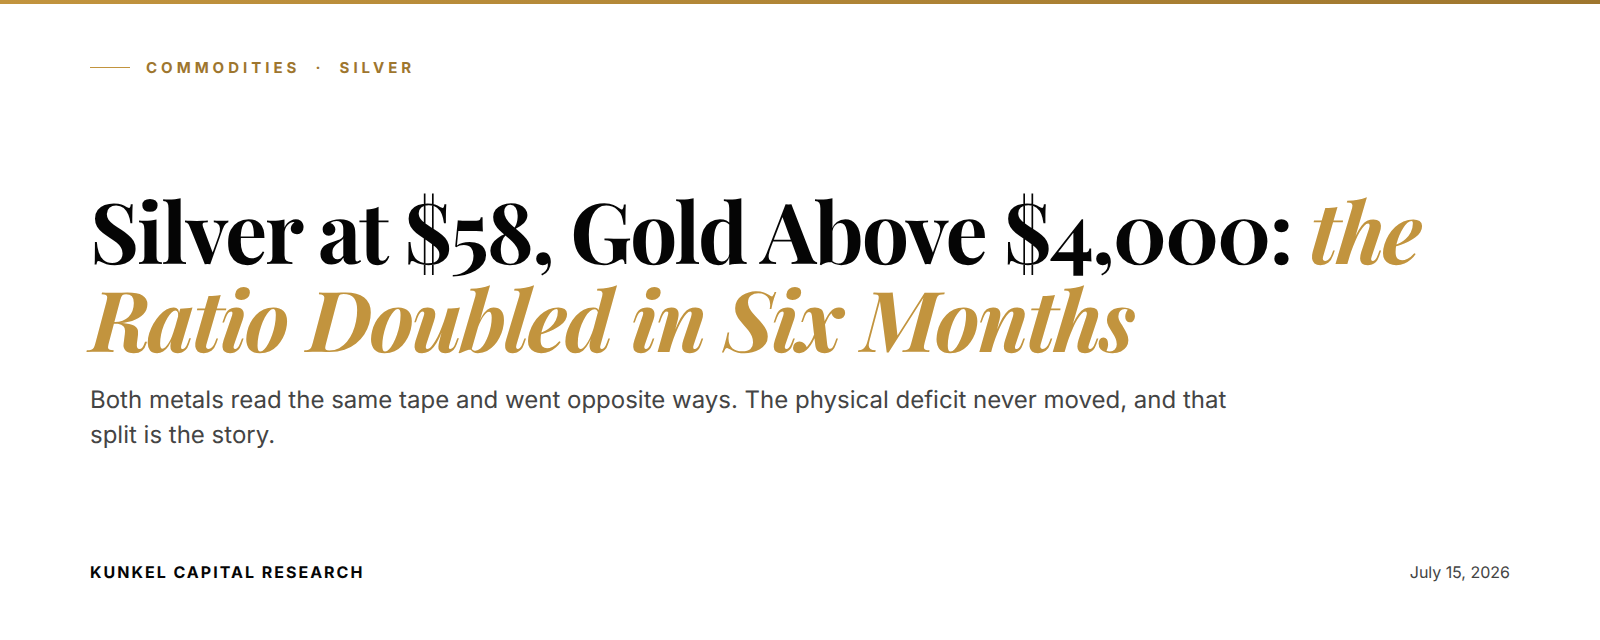
Silver touched $58.55 on Tuesday, its weakest print since December 9, and it did so on a day when gold was busy reclaiming $4,000 after the soft inflation report. That split is worth sitting with for a moment. Both metals were reacting to the same tape: a widening conflict around Iran, an oil spike, and a Fed that markets now expect to stay hawkish. Gold read that mix as a reason to rally. Silver read it as a reason to fall to a seven-month low. The gap between those two readings has become the most interesting chart in metals.
The gold-silver ratio measures how many ounces of silver one ounce of gold buys, and right now that number sits near 69. Back in January, when silver printed its record just above $121, the same calculation gave you a figure around half of today's. In other words, silver has roughly halved against gold in six months. It managed that while the physical market stayed in deficit.
The setup in 3 lines:
- Silver fell to $58.55 on July 14, its lowest level since December 9, while gold held above $4,000 through the same session.
- The gold-silver ratio has climbed to about 69, roughly double where it stood at silver's January record.
- The Silver Institute still projects demand running ahead of supply this year, which means the halving came from positioning, not from the metal's actual balance sheet.
To understand why that matters, you have to go back to one specific afternoon in January.
January 30 still explains most of this chart
On January 30, silver fell almost a third in a single session, sliding from above $121 to near $76 before the close. The trigger that afternoon was the nomination of Kevin Warsh as the next Fed chair, which markets read as a promise of higher rates for longer. Gold dropped around 10% on the same news. But the size of silver's move had little to do with monetary policy. It had the same mechanical fingerprints as the 2011 collapse: margin hikes, over-margined longs forced out, and paper contracts hitting the market faster than any physical buyer could respond.
Since then the metal has never really found its footing. Each bounce has been sold, and each macro scare has hit silver harder than gold. Tuesday's slide to the December floor was just the latest step in that sequence. So when you hear that silver is down 52% from its record, remember what kind of decline this has been. It started as a one-day liquidation cascade, and it has continued as a slow bleed of traders who bought the mania and are still getting out.

That distinction matters because a positioning unwind and a demand collapse look identical on a price chart, yet they resolve very differently. Which brings us to the part of the story that hasn't moved at all.
The deficit is still there, which makes this a positioning story
While the price was halving, the physical balance stayed stubbornly the same. The Silver Institute continues to project another year of demand running ahead of mine and recycling supply, driven by solar panels, electric vehicles and AI hardware. That deficit has persisted through the entire drawdown. Ore doesn't care about margin calls. And a solar plant that needs silver paste for its panels doesn't postpone production because a futures trader in New York got one. Factories kept buying the metal at $100, and they're still buying it at $58.
There's an honest counterpoint, though, and it deserves space here. Sustained high prices pushed solar manufacturers and jewelry fabricators to engineer silver out of their products where they could, a process the industry calls thrifting. That substitution is real, and it chips away at future demand. But it works slowly, over cycles measured in years. It can't explain a 52% drawdown inside six months. And it didn't flip the balance to surplus.
69 ounces of silver for one ounce of gold. In January it took roughly half that. The metal halved against gold while its physical market stayed in deficit.
Think of the whole episode like a run on warehouse receipts. The warehouse still holds the goods, and the people who need those goods keep collecting them. The receipts, though, changed hands with so much borrowed money behind them that their price collapsed anyway. In plain terms: the paper market panicked and the physical market didn't, which is why the two now tell such different stories.
If you want the longer version of that divergence before the January mania, our silver breakout study and the post-mortem on that call walk through it level by level.
A hawkish Fed is the reason the floor keeps getting tested
None of this rescues silver on its own, because the macro pressure is real and it's currently pointed the wrong way. June inflation came in at 3.5%, down from 4.2% in May, yet the oil spike from the Gulf has markets pricing roughly even odds of a September rate hike. Higher real yields punish metals that pay no interest. They punish silver twice, because its industrial demand also gets marked down whenever growth fear enters the picture. Gold at least keeps its central-bank bid through a hiking cycle, because reserve managers buy for reasons that have nothing to do with yield. Silver has no such buyer of last resort, so every hawkish headline lands on it with full weight. We covered the same squeeze from the gold side in our real-yield read on the Warsh Fed.
Here's where we correct our own first draft, because our instinct this morning was to frame Tuesday's low as capitulation. Actually, that's not quite what the tape shows yet. A capitulation low usually comes with a final rush of selling and a sharp reversal, the pattern we documented in palladium's washout last quarter. Silver's decline has instead been orderly, almost patient, and the speculative money that piled in during January hasn't fully left. Until it does, calling a bottom is guessing. We'd rather describe the structure than guess.
The five numbers that frame silver's year so far:
- $121.62 at the January record, the top of the mania phase.
- A one-day fall of nearly 33% on January 30, the largest single-session break since 2011.
- $58.55 on July 14, the lowest print since December 9 and a 52% drawdown from the record.
- A gold-silver ratio near 69, roughly double its January reading.
- Another projected supply deficit for 2026, per the Silver Institute, unchanged through the entire decline.
Four of those five numbers describe the paper market. Only the last one describes the metal itself, and it's the one that hasn't moved.

The December floor is now the line the whole read stands on
Step back from the daily noise and the structure gets fairly simple. Silver spent December building a floor in the high-$50s, spent January in a vertical mania, and has spent the five months since giving the entire move back. On Tuesday the price came all the way home to that December floor. The first test of it held. Gold holding $4,000 through the same session tells you the monetary bid for precious metals is intact, so the question is whether silver's industrial discount has finally run out of sellers.
Our structural read is simple. The drawdown is a positioning cleanse inside a market whose physical deficit never went away, and the December floor is where that thesis proves out or fails. Silver is one of the assets on the Kunkel Capital rotation: members get the full structure map with entry, exit and invalidation refreshed on a fixed cycle.
And the thesis breaks under conditions you can watch on any free chart. A weekly close beneath the December floor, with gold still firm above $4,000, would mean the selling is no longer positioning. It would point to something structural breaking in industrial demand, and that is where we are wrong. Should the floor hold while the ratio starts compressing from 69, the cleanse is likely complete, and the ratio snap-back framework we published earlier this year describes what usually follows. For the flow side, the commercial positioning signal is the tell we'd track from here.
What this post deliberately leaves out is the execution layer. That means the zone where our wave count says the risk-reward flips, the retracement marks derived from it, and the exact price where the setup is invalid rather than merely stretched. Reading the story and trading it are different jobs. The second one is what the membership is for.
Know your entry, your exit, and where you are wrong on Silver
This post gave you the what and the why: a 52% drawdown built on positioning, a deficit that never moved, and the December floor as the deciding line. The Kunkel Capital research adds the where and the when. Silver is on the watchlist. Members see the current wave count mapped to a defined entry zone, an exit zone and the exact invalidation level, refreshed on a fixed rotation, with alerts when the levels trade. €19.99 first month, then €34.99. Cancel anytime.
Frequently asked questions
Why is silver falling in July 2026?
Silver fell to $58.55 on July 14, its lowest since December 9. The pressure came from rising rate-hike odds after the Gulf oil spike and from continued unwinding of the margin-heavy positions built in January, while physical demand remains in deficit.
How far has silver fallen from its 2026 high?
Silver peaked just above $121 in January 2026 and traded near $58.55 on July 14, a drawdown of roughly 52% in about six months. Nearly a third of that fall happened in a single session on January 30.
What is the gold-silver ratio saying right now?
The ratio sits near 69, meaning one ounce of gold buys about 69 ounces of silver, roughly double the reading at silver's January record. Historically, extreme ratio readings have marked periods where silver was cheap relative to gold, though the ratio can stay stretched for months.
Is silver still in a supply deficit in 2026?
Yes. The Silver Institute projects demand from solar, electric vehicles and AI hardware to exceed mine and recycling supply again this year. High prices did push some manufacturers to reduce silver content per unit, but that substitution works over years, not months.
What level matters most for silver now?
The December floor in the high-$50s, which the market retested on July 14. A weekly close below it while gold stays firm would argue the decline is structural, while a hold there with the gold-silver ratio compressing would suggest the positioning cleanse is complete.
Sources: Silver Institute 2026 market forecast, CFTC positioning data, exchange price records, July 14-15, 2026.
Last updated: 2026-07-15