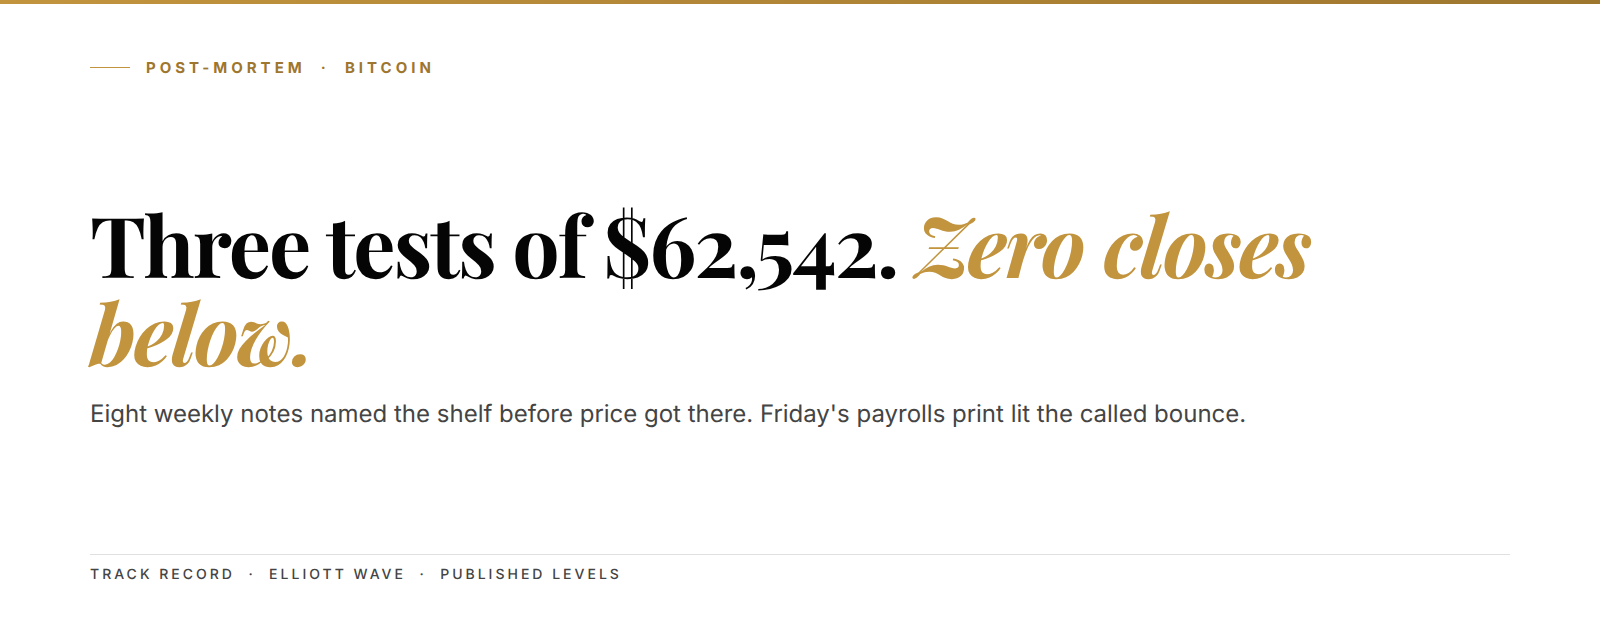
Bitcoin reclaimed $65,000 on Friday, hours after the July payrolls report showed the US economy lost 23,000 jobs. A post-mortem is a review of a published call after the market has graded it, and the tape just graded this one. Coming into the week the bearish case looked loaded. The Fed was openly split on hiking. ETF outflows were running four sessions deep. And a $38.3 million hardware-wallet exploit had soured the mood. What broke instead was the selling. It broke on a shelf our research had printed, unchanged, in eight straight weekly notes.
The setup in 3 lines:
- Eight weekly Kunkel Capital notes since 15th June named $62,542.62 as the upper edge of Bitcoin's support band.
- Price tested that shelf three times in four sessions, printing lows of $62,466, $62,275 and $62,300, and never closed below it.
- Friday's minus 23,000 payrolls print crushed September hike odds and lit the called bounce to a $65,391 high.
The tension had names and a date attached. On 29th July the Fed held rates at 3.50% to 3.75% for a fifth straight meeting. But three officials, Beth Hammack, Neel Kashkari and Lorie Logan, voted to hike. That 9-3 split under Chair Kevin Warsh handed traders a committee arguing about tightening, and the crypto complex took it badly. Spot Bitcoin ETFs bled $526 million in the four sessions into the decision, then another $265.4 million walked out on 31st July alone. We tracked that slide live in how Bitcoin's $60,000 floor held a hawkish Fed. If you only watched the flows, the next stop looked like a breakdown.
Eight weekly notes carried $62,542.62 before price ever got there
The line at the center of this post-mortem wasn't drawn last week. Every weekly Bitcoin note we published from 15th June through 3rd August carried the same sentence. The slide off the confirmed macro top should end in a support band whose upper edge sits at $62,542.62. Same number, eight notes running, all printed while the market traded thousands of dollars higher. Back then the worry of the day was the pre-Fed slide toward $60,000.
That record matters because a level only proves something when it's public before the tape arrives. A band drawn after the low is curve-fitting, and curve-fitting convinces nobody. A band drawn seven weeks before the low is a testable claim. So the dates stay in this review, because they are the evidence.
Put simply, an accumulation band is a pre-set price area where longer-term buyers plan to build positions. It works like a grocery list you write in June with the prices already filled in. You decided in advance what you'd pay. So when the store panics in August, there's no thinking left to do, only executing. That's the whole point of mapping levels early.
Three tests in four sessions: $62,466, then $62,275, then $62,300
By late July the market finally delivered the test, and it delivered three of them. The lows tell the story better than any indicator could:
- 31st July: low of $62,466, with the session closing back up at $62,888.
- 1st August: low of $62,275, the deepest print of the entire sequence.
- 3rd August: low of $62,300, the last time sellers got anywhere close.
Three probes landed inside half a percent of the published line. Not one daily close finished beneath it. Each test also came on fading downside momentum. That is what an exhausted move looks like: sellers keep arriving at the same shelf and keep getting absorbed.
The backdrop made that absorption louder. Those lows printed into the hawkish Fed split and into the ETF outflow run that followed the first spot-ETF closure. They also absorbed the Coldcard exploit headlines that cost holders $38.3 million. Bad news kept landing, and the same shelf kept holding. In plain terms: the crowd was selling the news into buyers who had a standing order at a mapped price, and those buyers never moved.

$62,275. The deepest print of the sequence landed $268 below a line first published seven weeks earlier.
Friday's minus 23,000 payrolls print flipped the rate regime in one morning
Then the macro side did its part. The Bureau of Labor Statistics reported on 7th August that July nonfarm payrolls fell by 23,000, against forecasts for a gain near 80,000. Losing jobs is grim news for the real economy, but for rate policy it settled the argument. By Friday's close the market priced a September hike near one chance in five. Before the print it had been closer to even money. A single morning release rewired the entire week.
Risk assets read the shift almost instantly. The Nasdaq 100 finished the week up 4.8%, its best run since the July rate-hike scare washed out. The same print sent silver to a six-week high. Bitcoin's reaction was quieter but mattered more for this review. Price lifted off the shelf and touched $65,391 on Friday, its highest mark since late July.
The flows flipped with the odds. Spot Bitcoin ETFs took in a net $101.7 million on 7th August, led by BlackRock's IBIT at $86.7 million. The complex had bled more than $790 million across the prior two weeks. Wallets holding 10 to 10,000 BTC told the same story. They added roughly 20,000 coins worth about $1.2 billion through late July and early August. It's the same cohort behavior we flagged when stablecoin mints front-ran Bitcoin demand. Translation: the crowd sold the Fed split at the lows, and the size bought it from them.

Minus 23,000 jobs. One payrolls line took the September hike off the table and put the bid back under Bitcoin.
The called bounce is up 5% and has done nothing wrong yet
Our 3rd August note went out four days before the payrolls release. It said the next act should be a corrective bounce off the shelf before the larger base finishes building. So far the tape is following that script. The bounce started from the exact area the notes described. From the $62,275 low to Friday's $65,391 high, the recovery measures 5%. The weekend has held the gains near $64,900 as of 9th August.
What the bounce hasn't done yet is prove its degree. Wait, that needs saying more honestly: a 5% lift confirms the shelf, but it doesn't yet confirm the size of recovery the count calls for. Until it does, this stays a graded-in-progress call rather than a finished one. We'd rather flag that now than pretend the scorecard is closed.
Bitcoin is one of the assets on the Kunkel Capital rotation: members get the full structure map with entry, exit and invalidation refreshed on a fixed weekly cycle.
Scorecard: one clean hit, one $268 overshoot, one open question
Honest grading cuts both ways, so here is the full sheet.
The hit: the upper edge held. A level named eight weeks in advance capped the entire downside sequence, three tests and out. That is the strongest kind of evidence a structural method can produce in public, because the timestamps do the arguing for it.
The miss: our earlier notes described the first probe as missing the shelf by barely a dollar. That was true of the initial touch on the intraday frame. But the August retests cut deeper: the $62,275 print sat $268 below the line before buyers took control. Structure hands you a zone, not a tick, and the notes should have framed it that way from the start.
The open question: degree. The map still expects this recovery to stall at some point. From there it allows one final slide into the deeper slice of the band before the base completes. Where that slice starts and ends is member material, but the sequence itself is public and on record here.
Where the thesis breaks from here
Every call we publish comes with the condition that kills it, because a read you can't be wrong about isn't a read. For this one the condition is plain. The bounce keeps its grade as long as pullbacks hold above the August floor. A daily close below $62,275, the 1st August low that sits on any free chart, while ETF outflows resume would break the thesis. It would say the shelf failed on a fourth test, and that the deeper slice of the band opens sooner than mapped. That is where we're wrong. And we'd grade it in the next note the same way we're grading this one.
The post-mortem in seven receipts
For readers who want the whole review in one block, here it is:
- 15th June: the weekly Bitcoin note first names $62,542.62 as the upper edge of the support band.
- Seven further notes repeat the identical level through 3rd August, all on record before the test.
- 29th July: the Fed holds at 3.50% to 3.75% with a 9-3 split, and two-week ETF outflows reach $791 million.
- 31st July to 3rd August: three lows print at $62,466, $62,275 and $62,300, none closing below the line.
- 3rd August: the weekly note calls a corrective bounce off the shelf as the next move.
- 7th August: payrolls print minus 23,000, September hike odds collapse, and ETFs take in $101.7 million.
- 7th August: Bitcoin touches $65,391, up 5% from the low, with the called bounce now running.
Frequently asked questions
Did Kunkel Capital really publish the $62,542 level before the low?
Yes. The level appears word-for-word in every weekly Bitcoin note from 15th June onward, all timestamped in the member archive. The deepest market print against it was $62,275 on 1st August, $268 through the line.
Why did a bad jobs number push Bitcoin up?
Because the rate path matters more to Bitcoin than the jobs themselves. Losing 23,000 jobs made a September hike unlikely, and falling hike odds are fuel for assets that pay no yield. Lower rates make scarce assets easier to hold. The same mechanism lifted silver and the Nasdaq 100 the same day.
Is the Bitcoin correction finished?
Our read says not yet. The bounce we called is running, but the count still allows one final slide into the deeper part of the band before the base completes. The public version stops there; the member notes carry the levels and the timing.
What would prove the whole read wrong?
A daily close below $62,275 while ETF outflows resume. That combination would mean the shelf failed on a fourth test, and we would regrade the map in the following weekly note, receipts included.
Know your entry, your exit, and where you are wrong on Bitcoin
The held shelf and the payrolls flip are the public surface of this setup. Bitcoin is on the Kunkel Capital watchlist. The full research maps the current wave count to a defined entry zone, an exit target and the exact invalidation level. It refreshes weekly, with alerts when levels hit. €19.99 first month, then €34.99. Cancel anytime.
Last updated: 2026-08-09