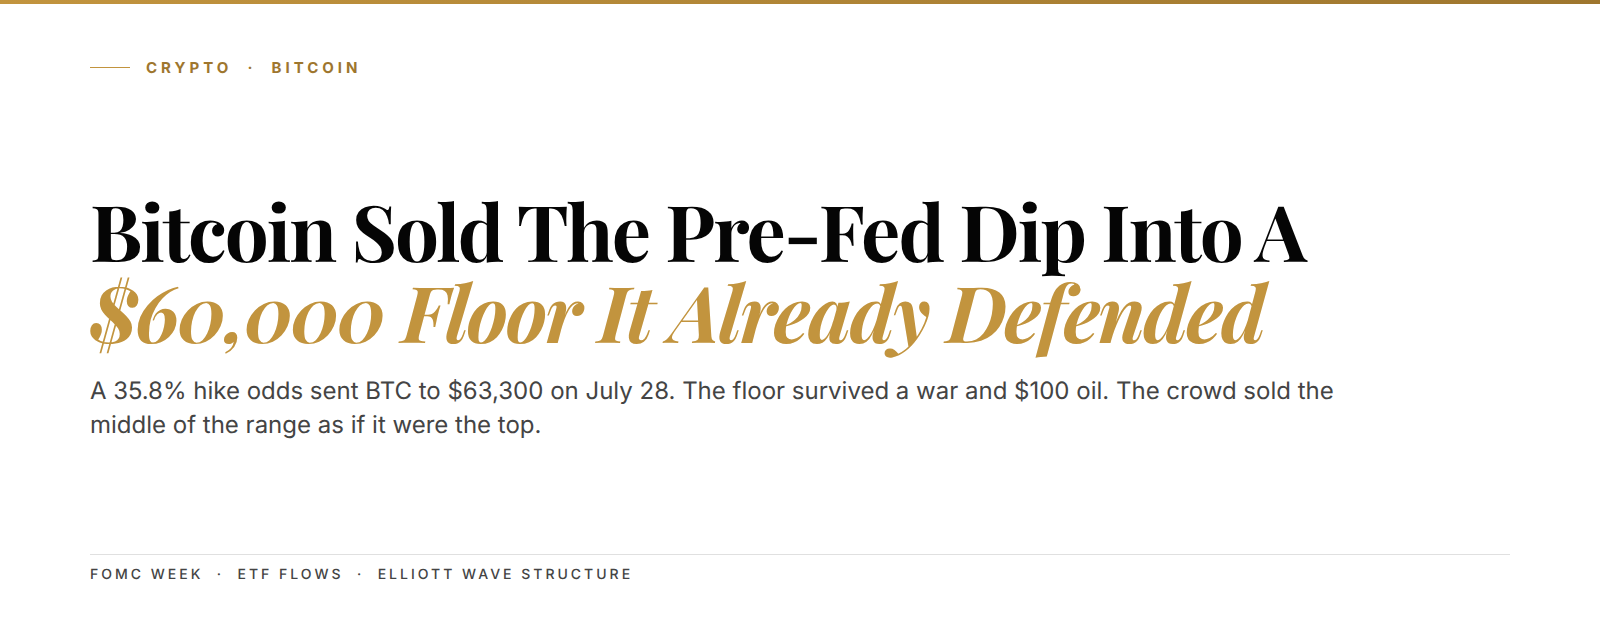
Bitcoin fell 2.5% to $63,300 on Tuesday, July 28, the day the Fed sat down for a two-day meeting nobody can call. The crowd read it as risk-off and sold the dip into the print. Rate-hike odds on the CME FedWatch tool jumped to 35.8%, up from 25.7% a week earlier. Here's the part the whole panic skips. Bitcoin has defended the $60,000 floor through a Middle East war, oil above $100, and a week of ETF outflows. A coin-flip Fed meeting didn't break that floor, it just scared the late money out of it.
The setup in 3 lines:
- Bitcoin dropped to $63,300 on July 28 as Fed hike odds hit 35.8%, a ten-point jump in a week.
- The $60,000 floor has held through war, $100 oil, and $465 million of ETF outflows on July 23-24.
- Higher lows since June point to a corrective pause inside the range, not the start of a breakdown.
One number frames the whole week. On Monday, July 27, Bloomberg reported that spot Bitcoin ETFs snapped a seven-session inflow streak, with more than $465 million pulled out on July 23 and 24 alone. BlackRock's IBIT, the largest of the funds, still held $47.7 billion in net assets that same day. So the money that left was the nervous money, not the core, and that gap is the whole story.
Bitcoin slid 2.5% to $63,300 the day a Fed meeting nobody can call began
Bitcoin opened at $63,706 on Tuesday and drifted lower from there. By mid-morning in New York it traded near $63,300, down 2.5% on the day. The selling wasn't the dramatic kind at all. It was the slow, steady sort that shows up when nobody wants to hold risk into a decision they can't predict.
And this decision is genuinely hard to predict. The FedWatch tool, which reads rate-hike odds straight off futures pricing, put the chance of a hike at 35.8% on Tuesday. That's up from 25.7% a week earlier. So in seven days the market moved a full ten points toward pricing a hike, and crypto felt it first. The same scare hit stocks, as we covered in the Nasdaq 100 rate-hike read.
Crypto felt it first for a simple reason. Bitcoin trades around the clock and never waits for a bell. When macro fear rises, it shows up in the one market that's always open. That's why Bitcoin often moves before stocks do, not because it's leading but because it can't close.
Translation: the dip wasn't Bitcoin-specific. The whole market flinched at a Fed meeting, and Bitcoin flinched out loud because it's the only asset trading before the sun comes up.
The $60,000 floor held through a war, $100 oil, and a week of outflows
The floor is the part consensus keeps forgetting. For weeks now, Bitcoin has traded in a band roughly between $58,000 and $68,000. Every serious test of the low $60,000s has been bought. That held even when Brent crude pushed above $100 on Middle East supply fear, a move we mapped in the Brent war-premium piece. It held again when the US paused airstrikes on Iranian targets and risk assets whipsawed.
So think hard about what that means. Bitcoin ate a war premium in oil, a geopolitical shock, and a run of ETF outflows, and it still sits in the mid-$60,000s. A fragile market cracks on any one of those, and this one didn't.
The local high tells the other half of the story. Bitcoin printed $67,900 earlier in July before fading back, so the ceiling is well marked. Buyers defend the low $60,000s while sellers show up near $68,000. This is a range, and ranges resolve, but they resolve on their own clock, not the Fed's.
Here's the honest caveat. A range this tight can break either way, and we're not pretending the floor is guaranteed. The narrower point is this: the pre-Fed dip sold the middle of the range as if it were the top, and that's a positioning mistake, not a structural one.
$60,000. That's the floor Bitcoin defended through a war, $100 oil, and a week of ETF outflows, and the pre-Fed panic sold it anyway.
A 35.8% hike odds is a coin flip the crowd is trading as a certainty
Look at the actual number the market is scared of. A 35.8% chance of a hike means a 64% chance of no hike. So the base case is still that the Fed holds. Yet Bitcoin traded on Tuesday like the hike was already booked, and that mismatch between the odds and the price is the setup.
Here is where the crowd and the tape disagree:
- Rate-hike odds sit at 35.8%, so the no-hike outcome is still almost twice as likely.
- Bitcoin sold off 2.5% anyway, pricing the scarier outcome as if it were settled.
- ETF outflows of $465 million on July 23-24 were late money leaving, not the core position.
- BlackRock's IBIT still held $47.7 billion on July 27, so the base didn't move.
- The $60,000 floor never broke through any of it.
Translation: the market bet on the unlikely outcome and sold the floor to do it. When the crowd leans that hard on a coin flip, the more interesting trade is usually the other side.

Now the caveat we owe you. If the Fed actually hikes today, the short-term reaction could be ugly, and no structure survives a genuine surprise unbruised. But a hold, which is still the base case, removes the exact fear that drove Tuesday's selling. The flow read here rhymes with the Ethereum ETF-flow flip we wrote up last week.
Higher lows since June say this is a corrective pause, not a breakdown
The shape of the chart matters more than any single day. Since June, Bitcoin has carved a series of higher lows, each dip bought a little above the last. In Elliott Wave terms, the reading we use to map market structure, that pattern looks like a corrective pause inside a larger up-move. A breakdown makes lower lows, and this one isn't doing that yet.
So far the tape just keeps on rhyming. Each sell-off since June has found a bid before the previous low gave way, which is textbook consolidation. The Fed dip fits the same rhythm, a scare bought a little higher than the last scare. That's what a floor looks like while it forms.

Bitcoin is one of the always-on assets on the Kunkel Capital watchlist, and members get the full structure map with entry, exit, and invalidation refreshed on a fixed cycle. For now, the public read is enough to see the disagreement. The crowd is trading a breakdown that the price structure hasn't confirmed.
Think of it like a boxer taking body shots but never going down. Each punch looks bad in the moment. But if he keeps his feet round after round, the story isn't the punches, it's that he's still standing.
Miners cut hashrate 6.3% while pivoting to AI, and the supply math shifts with them
Underneath the price, the miners are changing what Bitcoin is. Network hashrate, the total computing power that secures the chain, fell 6.3% over the last quarter to about 940 exahashes. That's roughly 12% below the December 2025 peak. The reason behind it isn't a crash. Miners are ripping out Bitcoin rigs and installing AI hardware, because a fixed AI lease pays better than volatile mining rewards.
This is a slow, structural shift, not a one-week headline. Listed miners signed more than $70 billion of AI co-location deals through early 2026, and some could earn most of their revenue from AI by year-end. The same demand pull runs through the whole AI complex, which we traced in the NVIDIA circular-financing piece. Fewer machines mine Bitcoin now, and the ones that stay are the efficient survivors.
What this means for price is subtle. Miners who pivot to AI have steadier cash flow, so they're less forced to dump coins to pay power bills. Less forced selling from the group that historically supplied the market is a quiet tailwind. You won't see it on a daily candle. It shows up over quarters.
For now, that's depth, not a trigger. The trigger this week is the Fed, and the same rate-and-real-yield tension is pushing gold, which we unpacked in the gold real-yields read. But the miner shift is the slow current that decides where the range breaks once the Fed noise clears.
Where this read is wrong: a weekly close back under the $58,000 shelf
So here's the full thesis, stated plainly. The pre-Fed slide to $63,300 was the crowd selling a coin-flip Fed meeting as if the scary outcome were certain. The $60,000 floor has already held through worse. Higher lows since June say the structure is still corrective, not broken, and the miner pivot to AI is quietly draining forced sellers from the market. So the range favors the buyers who keep defending the low $60,000s, as long as the floor holds.
Now the part that keeps us honest, because every read needs a line where it stops being right. Ours is behavioral, not a magic number. A weekly close back under the $58,000 shelf, with ETF outflows accelerating instead of stabilizing, is where this read is wrong. That combination would say the higher-low structure has failed and the late money leaving was early, not wrong. That's the invalidation, a condition you can watch rather than a secret we keep.
What the blog gives you is the what and the why. Bitcoin is being sold on a fear that's still only a 36% chance, into a floor that already survived a war and $100 oil. Where you act on that, plus the exact level that flips the read, is the part the full research maps.
Know your entry, your exit, and where you are wrong on Bitcoin
The pre-Fed slide to $63,300 is the surface signal. Bitcoin is one of the always-on assets on the Kunkel Capital watchlist. The full research maps the current wave count to a defined entry zone, an exit target and the exact invalidation level, refreshed on a fixed rotation, with alerts when levels hit. €19.99 first month, then €34.99. Cancel anytime.
Frequently asked questions about Bitcoin and the Fed decision
Why did Bitcoin drop on July 28, 2026?
Bitcoin fell 2.5% to about $63,300 as traders de-risked ahead of the Fed's two-day meeting. Rate-hike odds on the CME FedWatch tool had climbed to 35.8%, so the crowd sold risk into the uncertainty.
What is the key support level for Bitcoin right now?
The $60,000 area is the floor that has held for weeks, with a deeper shelf near $58,000. Bitcoin has defended the low $60,000s through a Middle East war, $100 oil, and ETF outflows.
Will a Fed rate hike crash Bitcoin?
A hike is still only a 35.8% chance, so the base case is a hold. A real hike could bring a sharp short-term reaction, but the structure only changes if the floor gives way on rising outflows.
What does the miner shift to AI mean for Bitcoin?
Miners cut network hashrate 6.3% last quarter as they moved power to AI leases. Steadier miner cash flow means less forced coin selling, which is a slow tailwind for price over quarters.
Is Bitcoin in a bear market in July 2026?
Not by the price structure, since higher lows since June point to consolidation, not a breakdown. That read is wrong only if Bitcoin closes a week back under the $58,000 shelf.
This is Kunkel Capital Research, daily market structure with Elliott Wave and Fibonacci, and none of it is investment advice.
Last updated: 2026-07-29