Brent crude settled at $84.95 on Wednesday, July 15, 2026, its highest close in a month, after the US restored its naval blockade of Iranian ports and struck dozens of military assets near the Strait of Hormuz. Crude is up 9% in five sessions. But the move has recovered only about a third of the slide that followed the June 17 interim peace deal. Consensus calls this another war premium to fade, because fading the last one paid. The flow math says this fade carries an expiry date, and it lands in mid-August.
The setup in 3 lines:
- The US restored its blockade of Iranian ports this week; the first blockade cut Iran's exports from 2 million barrels per day to under 300,000.
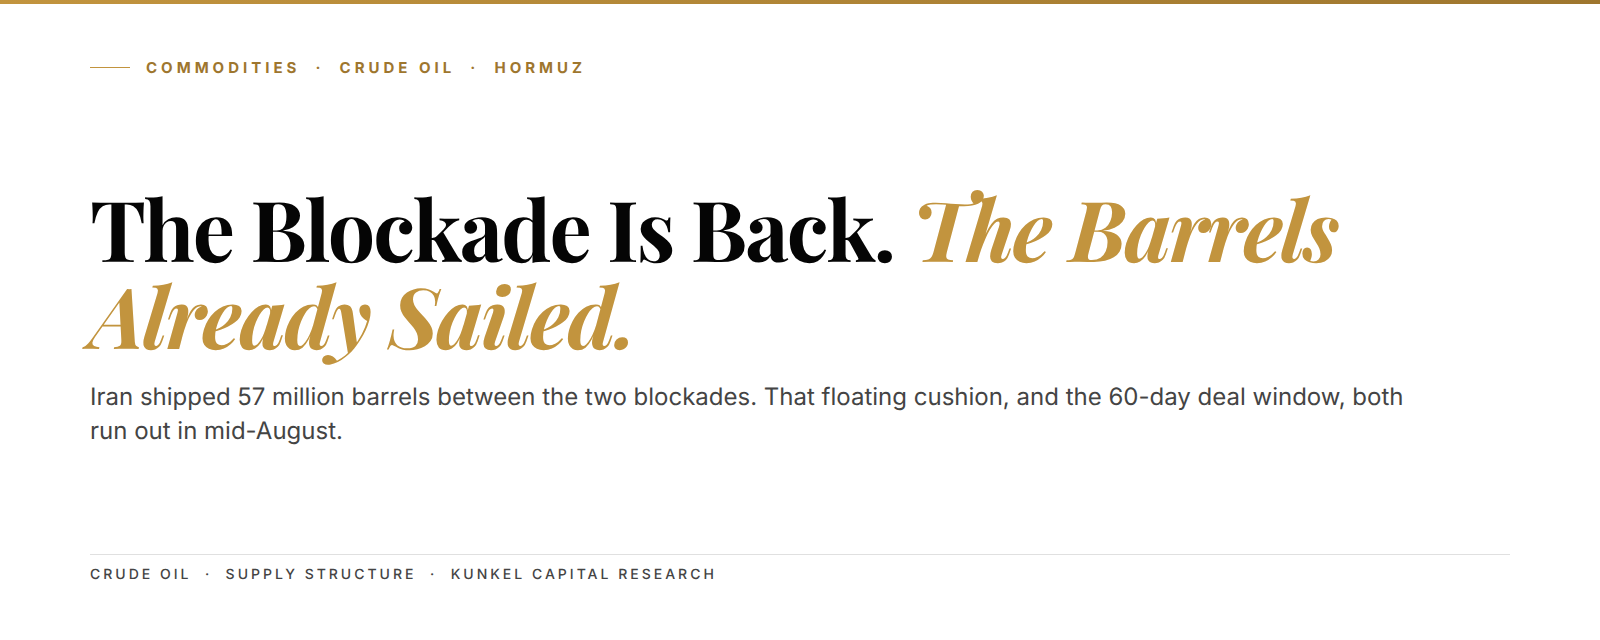
- Iran shipped 57 million barrels during the 28-day pause between blockades (Bloomberg tanker data, July 13), a floating cushion that keeps prompt supply loose into August.
- That cushion and the 60-day negotiation window both expire in mid-August, into a market holding maybe 1.5 to 2.5 million barrels of truly deployable spare.
The sequencing this week was unusually clean. President Trump posted on Monday that the blockade would return, and demanded a 20% fee on every other cargo moving through the strait. Late Tuesday, US Central Command said it had hit dozens of military assets along Iran's coastline in a seven-hour operation. By Wednesday the fee demand was gone, traded away for promised Gulf investment, but the blockade stayed. So two of the three escalation legs held. And WTI added all of 26 cents on the day, settling at $79.60. The tape barely blinked at any of it.
The first blockade took Brent to $126.41, this one bought a one-month high
When Washington blockaded Iranian ports the first time, on April 13, the market treated it as a genuine supply emergency. Daily tanker transits through Hormuz had already collapsed to single digits, and the IEA was calling the shut strait the largest supply disruption in history. Brent ran eight straight sessions into the end of April and touched $126.41, a four-year high.
This week's version is the same instrument at a fraction of the volume. The blockade is back, the strikes are live, and Brent sits in the mid-$80s. Some of that gap is real, because the strait itself is open this time and tankers are still moving. But most of it is memory. If you bought the April spike, you watched it unwind through May and June, and the reflex now is to sell the headline rather than the barrel. Our war-premium fade audit covered why that reflex made money.
The compressed timeline explains the muscle memory:
- Late February: the war begins and daily Hormuz transits collapse to single digits.
- April 13: the US blockades Iranian ports; exports fall from 2 million barrels per day to under 300,000 by May.
- April 30: Brent touches $126.41, its highest print in four years.
- June 17: the interim deal reopens the strait and starts a 60-day negotiation window.
- June 17 to July 13: Iran ships 57 million barrels at roughly a 20% premium to its pre-war pricing.
- July 13 to 15: the blockade returns, strikes resume, and Brent closes at $84.95.
Put that on one chart and the round trip is stark: an eight-session melt-up, a six-week bleed, and a bounce that has barely dented the range.

Iran front-loaded 57 million barrels, and they are still on the water
Bloomberg tanker data published July 13 put Iran's shipments between the two blockades at 57 million barrels. That works out to just over 2 million barrels per day, which is the country's full pre-war export rate. Iran didn't ease back into the market during the pause; it ran flat out. And it had every reason to, after a first blockade that bled it of billions in oil revenue. Iran's parliament speaker said on July 1 that the crude was clearing at roughly a 20% premium to pre-war pricing.
Think of a shop owner who hears his supplier is about to strike, so he triple-fills the stockroom before the trucks stop. For weeks afterward the shelves look completely normal. Anyone judging the strike by the shelves decides it isn't biting. But the stockroom is what keeps the shelves calm, and stockrooms empty on a schedule.
In plain terms: the barrels the new blockade is supposed to remove have already sailed. They are on the water now, and they discharge at refineries through early August. Prompt tightness can't show up while that is happening, no matter how aggressive the headlines get. Which means the muted price action this week isn't the market calling the blockade toothless. It's the market being paid out of a stockroom.
57 million barrels. A full month of blockade-sized supply, already paid for, already at sea, and gone by mid-August.
Two clocks converge on mid-August, and the market watches only one
The first clock is diplomatic, and everyone can see it. The June 17 memorandum set 60 days to reach a permanent deal, which puts the deadline near August 16. Miss it, and the framework that reopened the strait has no floor under it. Every macro desk has that date circled.
The second clock is physical, and it gets far less attention. Set the 57 million cushion barrels against the 2 million per day the blockade removes. The cushion offsets roughly four weeks of losses. Loadings stopped around July 14 when the blockade snapped back. Add a two-to-four week voyage from the Gulf to the main Asian discharge ports, and the last cushion barrels land just as the negotiation window closes. Both clocks point at the same week.
So the real question isn't whether the blockade is bullish today. It's what the tape does in the week both clocks hit zero. A deal by August 16 releases the pressure and validates the fade one more time. No deal means the deficit arrives exactly when the buffer is gone, and the market discovers it is short physical barrels with nothing left on the water. The two countdowns are worth seeing side by side.

August 16. Day 60 of the negotiation window, and roughly the day the last cushion barrels discharge.
Headline spare capacity says 5 million barrels, deployable spare says 1.5 to 2.5
On paper, OPEC+ holds more than 5 million barrels per day of spare capacity, the most since 2009 by EIA-style capacity accounting. Saudi Arabia claims about 3 million of it. Those are the numbers that make a blockade look absorbable, and they anchor the bear case.
The deployable number is smaller. Independent consultant estimates put true spare, meaning production available within weeks and without new capital, at 1.5 to 2.5 million barrels per day. The UAE still has close to 2 million barrels of offshore output shut in from the war, and it left OPEC outright on May 1, which leaves coordination weaker than in any prior crisis. We mapped that fracture in the spare capacity piece after the UAE departure. On top of that sits the geography problem from our phantom barrels read: most Gulf spare capacity loads inside the very strait it is supposed to replace.
There's a second-order effect worth naming. June CPI cooled to 3.5% mostly because energy prices fell, and that print moved rate expectations around this week. A crude market that re-tightens into September flips that support and puts a Fed hike back on the table. The asset that produced the disinflation can take it away again, and inventories were drawing even before the war started (we tracked that streak here).
Crude oil is one of the assets on the Kunkel Capital rotation: members get the full structure map with entry, exit and invalidation refreshed on a fixed cycle.
The structural read: a fade trade with an expiry date
Structure first. The April run to $126.41 was a terminal spike: eight sessions of vertical price into a four-year high, the kind of move that ends a trend rather than starts one. The give-back into early July retraced nearly the entire war move, and Brent spent two weeks basing in the high-$70s, a floor we wrote about when the physical market stopped confirming the slide. This week's push is the first impulsive leg off that base, and the prompt spreads that flagged tightness once before (the backwardation read) are the confirmation channel to watch from here.
We called the May fade, and it paid. So we owe an honest answer on why this isn't the same trade. In May, the blockade was choking flows in real time while the panic premium had nothing left to price once headlines cooled. Today the cushion sits on the supply side, and it drains on a visible schedule. Fading April meant fading a panic that had no barrels behind it. Fading this rally means fading arithmetic, and arithmetic doesn't capitulate. That distinction is the whole trade.
Wait, that cuts both ways, and it's worth saying so. The cushion also buys Washington and Tehran six weeks of painless brinkmanship: nobody's refinery runs dry while they posture, which is exactly why both sides escalated this week at so little cost. The part we can't model is political will. A signed deal inside the window makes the whole supply clock moot, and we'd put real odds on that outcome.
So here is where the thesis breaks. Two things would kill it. A permanent deal before mid-August that lifts the blockade ends the supply clock outright. And Iranian loadings climbing back toward pre-war rates while the blockade formally stands would mean it leaks; a leaky blockade removes nothing. On the tape, a weekly close back inside the early-July base after the cushion window passes would tell us the deficit never arrived, and we'd be wrong. Until one of those shows up, you treat dips into the August convergence as accumulation, not as the top of another failed war premium.
Know your entry, your exit, and where you are wrong on Crude Oil
The mid-August convergence is the surface signal. Crude oil (WTI and Brent) is on the Kunkel Capital watchlist. The full research maps the current wave count to a defined entry zone, an exit target and the exact invalidation level, refreshed on a fixed rotation, with alerts when levels hit. €19.99 first month, then €34.99. Cancel anytime.
Frequently asked questions
Why is crude oil up this week?
The US restored its naval blockade of Iranian ports and struck military assets near the Strait of Hormuz in a seven-hour operation late Tuesday. Brent settled at $84.95 and WTI at $79.60 on Wednesday, both one-month highs, with crude up about 9% over five sessions.
How much oil does the blockade actually remove?
The first blockade cut Iranian exports from about 2 million barrels per day to under 300,000 within weeks. A repeat removes similar volume, but the effect is delayed: Iran shipped 57 million barrels during the pause, and those cargoes keep supply loose into August.
Can OPEC+ replace the lost Iranian barrels?
On paper yes, since headline spare capacity tops 5 million barrels per day. In practice, weeks-deployable spare is closer to 1.5 to 2.5 million barrels, and much of it loads inside the Gulf, behind the same chokepoint that is under threat.
What would make this bullish read wrong?
A permanent US-Iran deal inside the 60-day window, or evidence that the blockade leaks and Iranian barrels keep flowing. On the tape, Brent falling back into its early-July base after mid-August would say the deficit never arrived.
Last updated: 2026-07-16