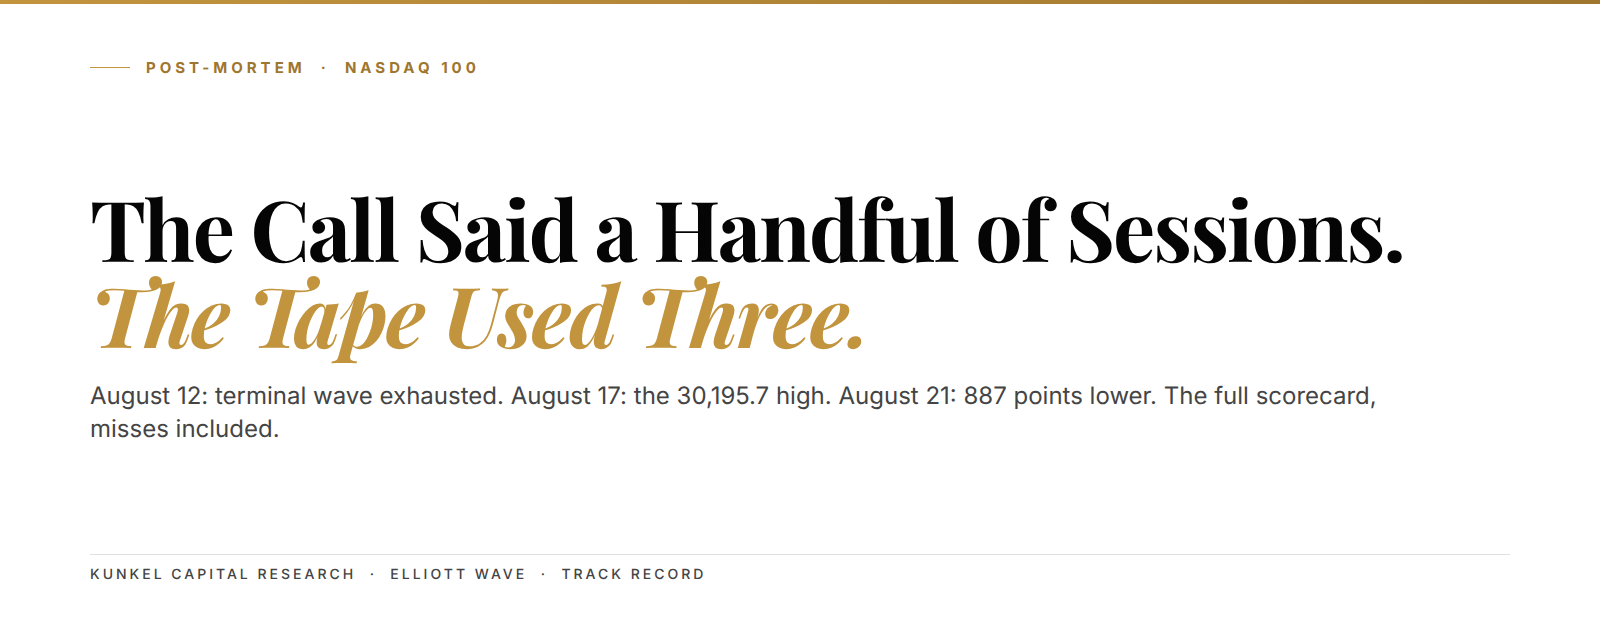
The Nasdaq 100 closed Friday at 29,308.9, a full 887 points below the 30,195.7 high it printed on Monday, August 17. Ten days ago, on August 12, we published a note saying this bull market's terminal wave had "exhausted its fuel". The cycle high, it said, would print within the next handful of sessions. It took three. Consensus spent that week chasing the index's first close above the 30,000 handle, and the bond market ended the chase. This is the post-mortem: what the call got right, the one thing it got stale, and the single number that now decides whether the read survives.
---
The setup in 3 lines:
- Our August 12 note called the Nasdaq 100's terminal wave exhausted and put the cycle high "within the next handful of sessions"; the index printed 30,195.7 three sessions later.
- A 5.34% thirty-year Treasury yield, the highest since 2007, then dragged the index down 3.6% peak-to-trough in four sessions.
- The top call stays live below the August 17 high; a daily close back above 30,195.7 is where the read fails.
Before the scorecard, one scene sets the week. On Wednesday, August 19, the U.S. Treasury said it would more than double the size of its debt buybacks. That was a direct attempt to pin down a long end that had just repriced to two-decade highs. The bond market gave the plan exactly one day of respect. By Thursday's close the Dow had shed 700 points, and the Nasdaq 100 was trading nearly 1,000 points below Monday's print.
Our August 12 note gave the top a handful of sessions, and the tape used three
The note went out at 13:00 on August 12, with the index finishing that day at 29,742.6. It argued that the terminal fifth wave of the advance had run out of fuel by nearly every measure we track. It also flagged the index holding far above the 27,516.5 mark, the 161.8% Fibonacci extension where extended fifth waves typically complete, while momentum bled out underneath. Because this is a post-mortem, we can print those numbers in full.
The instruction that followed was blunt. Holders of long positions should be locking in gains or rotating toward short exposure. Fresh shorts needed a tight leash, because the easy part of the ride already sat behind the market. The note allowed room for one final thrust, but it put the ultimate high inside a handful of sessions.
From there the tape did its part quickly. On Wednesday, August 13, the index rose 1.1% to 30,084.5, its first close above the 30,000 handle, and Thursday added a fraction more. Then on Monday, August 17, it stretched to 30,195.7, stalled, and closed all the way back at 29,995.4. That left a long upper wick where a breakout should have been.
Nothing has traded above that print since.
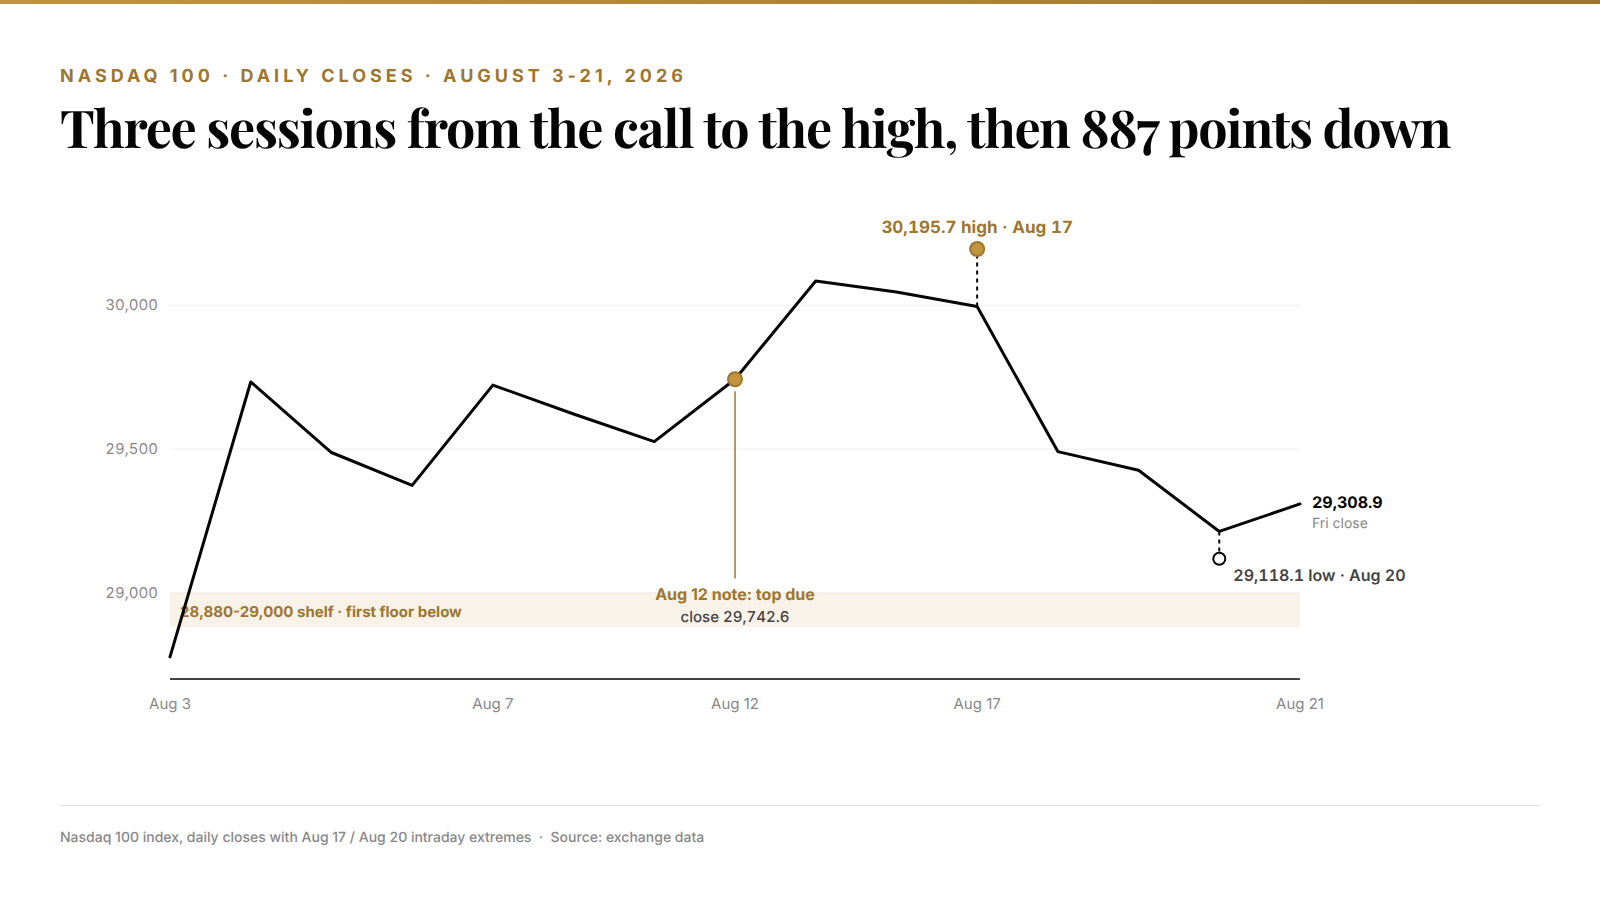
Three sessions. The August 12 note gave the cycle high "a handful of sessions" to print. The tape needed three.
A 5.34% thirty-year yield did what a negative payrolls print could not
To see why that Monday wick mattered, look at what equities had already absorbed without blinking. A negative July payrolls print of minus 23,000 jobs, with 103,000 in downward revisions behind it, produced a record close instead of a selloff. We broke that reaction down in the S&P 500's hike-off rally post. A soft retail sales report the following week got the same shrug, which we covered in the retail sales miss review. Growth data couldn't dent this tape.
The price of money finally did. On Tuesday, August 18, a global bond rout pushed the thirty-year Treasury yield to 5.34%, its highest level since 2007. The Nasdaq 100 fell 1.7% on the day. So the driver rotated: not jobs, not inflation prints, but the long end repricing what every future cash flow is worth.
Then came the Treasury's counterpunch and its failure. Wednesday's buyback-doubling announcement, the same move that put a bid under precious metals in our silver and yield-cap piece, eased yields for a single session while the index barely moved. On Thursday yields turned back up, the plan flunked its first real test, and the index tagged 29,118.1 before closing at 29,213.2.
Put simply: stocks stopped trading on the growth data and started trading on the cost of capital. Friday's feeble bounce to 29,308.9 closed the week down 2.5%, and it did nothing to change that handoff. We watched the same driver rotation play out in gold's fade after the flat PPI print.
Scoring the call: the timing clause earned its keep, the thrust band did not
A post-mortem only builds trust if it grades the misses with the same pen as the hits, the standard we set in the Bitcoin floor post-mortem. So here is the August 12 note, claim by claim, against the tape:
- "Cycle high within the next handful of sessions." The high printed three sessions later, at 30,195.7 on August 17. Four sessions have now closed below it. Right on timing, though four sessions cannot yet confirm a cycle top.
- "One final thrust" before the turn. Delivered. The index pushed 1.5% above the note-day close before stalling, and the thrust died in a single Monday morning stretch.
- De-risk at 29,742.6. The index closed Friday 1.5% lower than where the note said to lock in gains. Anyone who sold the thrust into 30,000+ did better still.
- The thrust band at 28,880-29,000. Stale, and we own that. More below.
- The 161.8% extension at 27,516.5. Untested so far. It remains the structural floor reference beneath this entire sequence.
- "Blow-off top into a devastating structural correction." Unproven. A 3.6% slide is a dip, not a verdict, and we grade it open.
Now the miss, because it deserves its own paragraph rather than a footnote. The note described room for a final thrust "into the 28,880-29,000 band", yet the index had already cleared that zone before publication, so the band was stale on arrival. The exhaustion read and the timing clause carried the call; the band did not, and pretending otherwise would be exactly the kind of selective memory post-mortems exist to prevent.
Wait, actually, the stale band has aged into something useful.
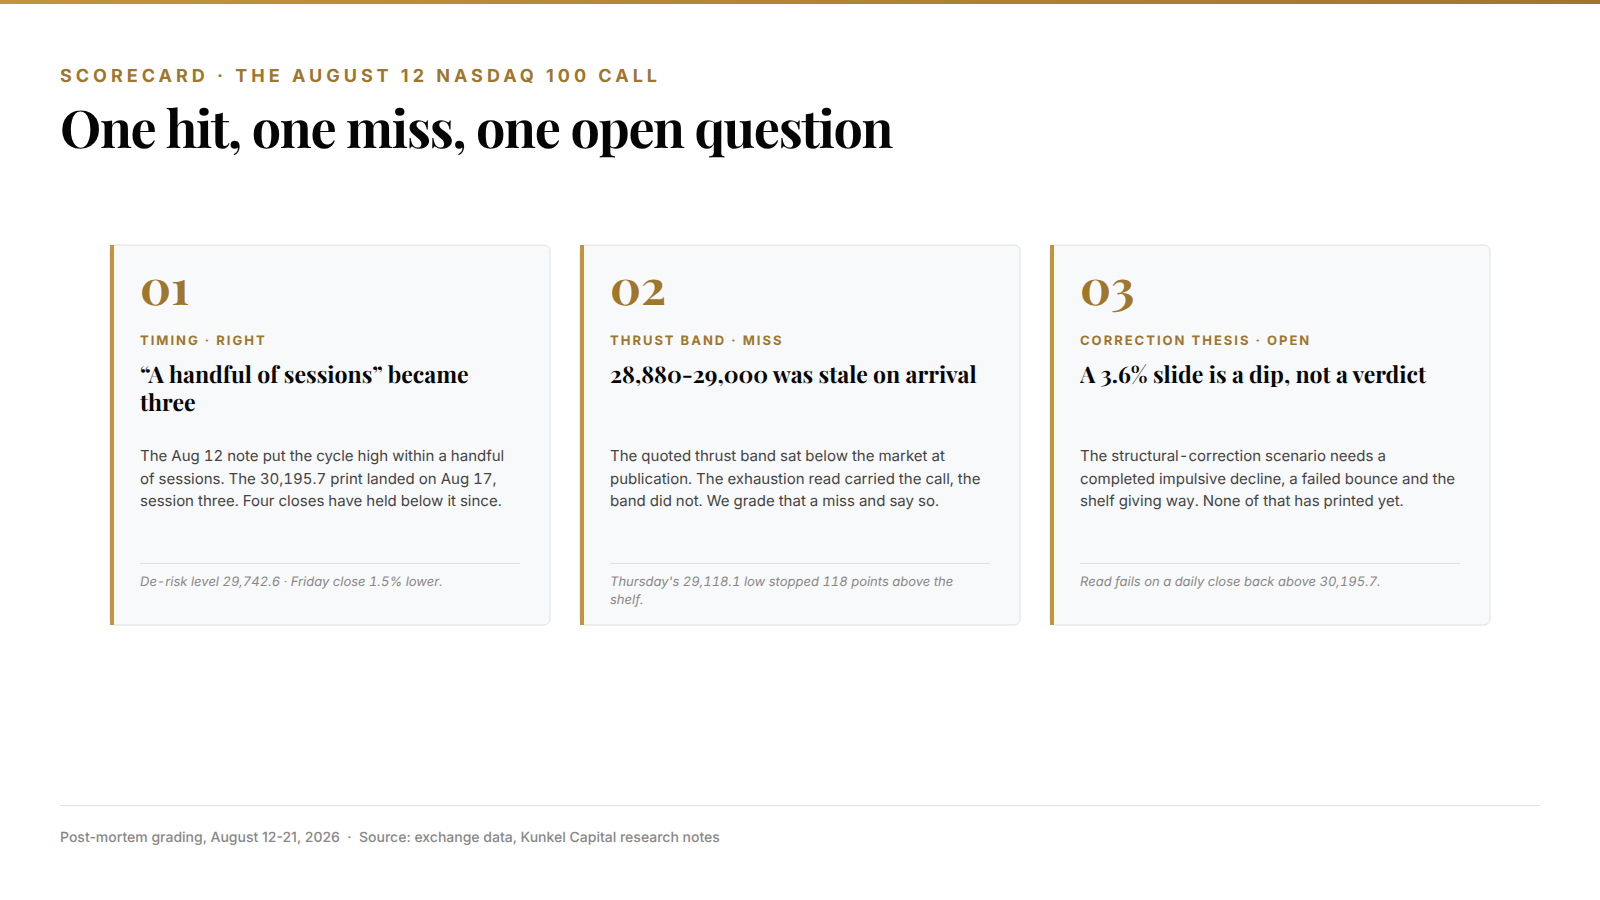
Thursday's low at 29,118.1 stopped just 118 points above that 28,880-29,000 shelf. That means the zone the note mislabeled as a ceiling is now the first market-visible floor the decline has to break.
An 887-point slide is still not the correction the note promised
Here's where honesty cuts against our own marketing. The August 12 scenario called for a top that transitions into a structural correction, and nothing about four red-tinted sessions proves that part. So far the decline is three lower closes and a bounce: enough to validate the exhaustion read, nowhere near enough to confirm the larger turn.
What would move it from dip to verdict is structure, not size. A completed impulsive decline on the daily chart, breadth failing on the next bounce, and the 28,880-29,000 shelf giving way would together shift the burden of proof onto the bulls. Until that sequence prints, the honest label for this week is "consistent with the call", and no stronger.
Think of an exhausted trend like a rope bridge at full load. It doesn't need a storm to give way, just one more heavy step, and you can rarely name the step in advance, only the load. That's what the note measured on August 12: not the trigger, but how much weight the structure was already carrying. The Nasdaq 100 is one of the assets on the Kunkel Capital rotation: members get the full structure map with entry, exit and invalidation refreshed on a fixed cycle.
5.34%. The thirty-year yield print that finally outweighed half a trillion dollars of AI capex promises.
Nvidia's Wednesday print and Warsh's first Jackson Hole keynote land on a weakened tape
The calendar now stacks two binary events onto a market that just lost its bid. Nvidia reports earnings on Wednesday, August 26. Its August 10 pact with six asset managers, including Blackstone, BlackRock and KKR, aims to mobilize more than $500 billion for AI infrastructure. That capex engine is the last load-bearing story under the terminal wave. The memory complex has run hardest on it, as we traced in Micron's rebound through $1,000, so a guidance wobble would hit far more than one ticker.
Two days later, on Friday, August 28, Fed Chair Kevin Warsh delivers his first Jackson Hole keynote as chair. After the July 29 meeting, where three FOMC members voted for a hike, he said he wanted the speech to "frame the big questions" instead of the "myopic" quarter-point debate. Surveyed fund managers overwhelmingly expect a neutral tone. That consensus is what gives a hawkish surprise its power: with September hike odds near a coin flip, nobody is positioned for one.
If you trade this index, the sequence matters more than any single level this week. A strong Nvidia print into a hawkish Warsh gets sold differently than a weak print into a dovish one. But both paths now start from below the August 17 high rather than above it. That starting point is what changed, and it's what the week's 2.5% decline actually bought the bears.
The read stays bearish until a daily close above 30,195.7, and that line is public
So the resolution is simple to state. The terminal wave most likely completed at 30,195.7 on August 17, with the long end of the bond market supplying the trigger. The burden of proof now sits with the buyers. The what and the why are fully on the table here, and you didn't need a subscription to read them.
The invalidation is just as public, because it's the prior high every chart shows. A daily close back above 30,195.7 with yields calm and breadth widening is where the thesis breaks. That is where we are wrong, and we would say so in the next note the same way we're grading this one.
What this post can't give you is the part the product exists for. Our count derives levels underneath this market: the zone where the structure says the decline should be bought or the bounce should be sold, and the exact price where each of those reads dies. Those numbers live in the member analyses, refreshed on the rotation, with alerts when they hit.
118 points. The distance between Thursday's low and the 28,880-29,000 shelf, the first floor this decline has to break.
Know your entry, your exit, and where you are wrong on the Nasdaq 100
The resolved top call above is the surface signal. The Nasdaq 100 is on the Kunkel Capital watchlist: the full research maps the current wave count to a defined entry zone, an exit target and the exact invalidation level, refreshed on a fixed rotation, with alerts when levels hit. €19.99 first month, then €34.99. Cancel anytime.
Frequently Asked Questions
Did the Nasdaq 100 top on August 17, 2026?
The index printed 30,195.7 on August 17 and has closed below it for four straight sessions. The slide reached 3.6% from peak to trough. That matches our August 12 exhaustion call on timing, but four sessions can't confirm a cycle top. Confirmation needs a completed impulsive decline and a failed bounce; the read fails on a daily close back above 30,195.7.
Why did the Nasdaq 100 fall this week?
The trigger was the bond market, not growth data. The thirty-year Treasury yield hit 5.34% on August 18, its highest since 2007, and Thursday's session showed the Treasury's doubled buyback program failing to hold yields down. The index lost 2.5% on the week and closed at 29,308.9.
What did the Kunkel Capital August 12 call actually say?
It said the terminal fifth wave had exhausted its fuel. It told holders to lock in gains or rotate toward short exposure at 29,742.6, allowed one final thrust, and put the cycle high within a handful of sessions. The high printed three sessions later. One element was stale: the quoted thrust band sat below the market at publication.
What are the key Nasdaq 100 levels to watch now?
On the market-visible side: 30,195.7 above, which is the August 17 high, and the 28,880-29,000 shelf below, which Thursday's low missed by 118 points. The model-derived zones beneath, and the prices where each scenario dies, are part of the member research rather than the blog.
What events could move the Nasdaq 100 next week?
Nvidia reports earnings on Wednesday, August 26, carrying the $500 billion AI infrastructure story. And on Friday, August 28, Fed Chair Kevin Warsh gives his first Jackson Hole keynote, with fund managers positioned for a neutral speech and September hike odds near a coin flip.
Sources: Bloomberg, Reuters, U.S. Treasury, Federal Reserve, exchange data.
Last updated: 2026-08-23