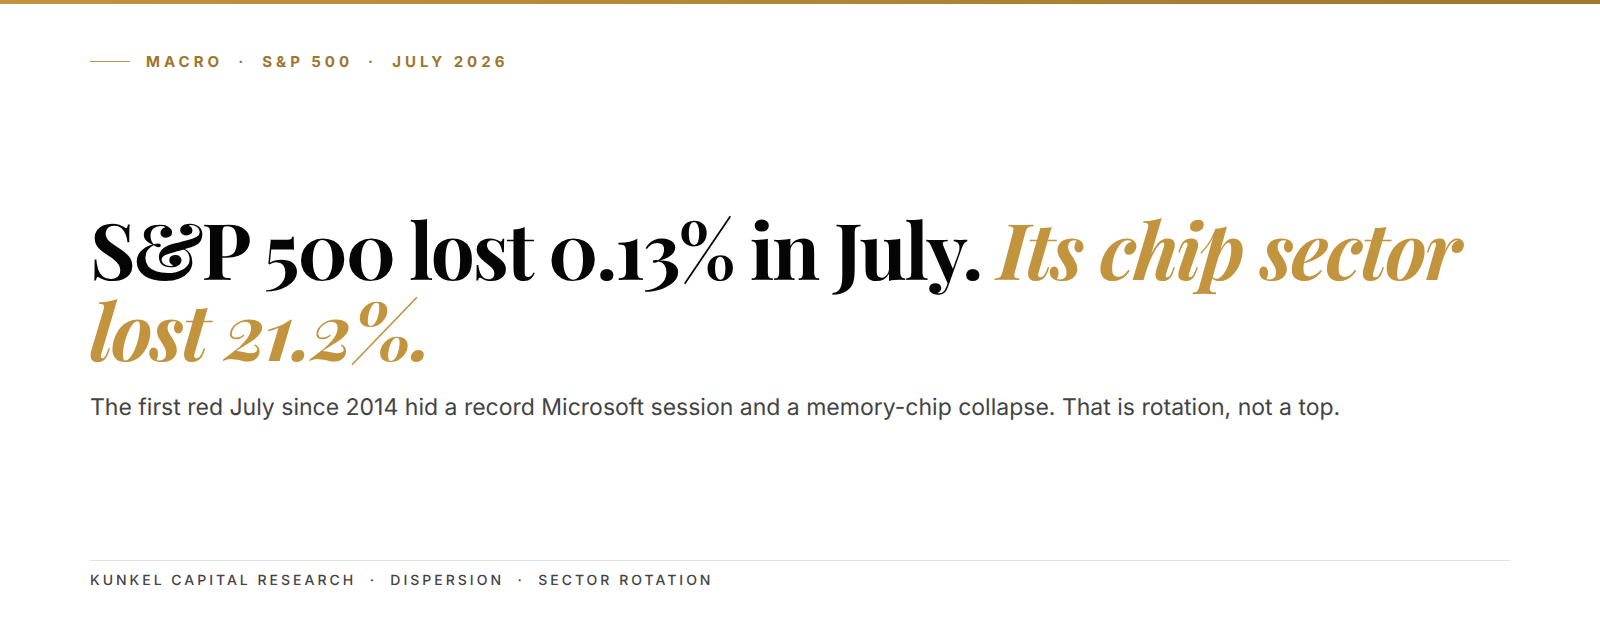
S&P 500 closed July down 0.13%, and that near-nothing number broke a twelve-year streak. It was the first losing July since 2014. Underneath the flat tape the month was violent, because the iShares Semiconductor ETF gave up 21.2% while Microsoft added roughly $450 billion of market value in one session on July 30. Consensus read the red month as the AI trade finally cracking. That read is wrong, and the two biggest AI chip names are the reason.
---
The setup in 3 lines:
- S&P 500 fell 0.13% in July, its first red July since 2014, while the semiconductor complex lost 21.2%.
- Damage sat in memory and equipment, not in AI compute. Nvidia finished July up 0.33%, Broadcom up 3.05%.
- Money rotated into energy and financials under a hawkish Fed. The equal-weight S&P 500 actually rose 1.05%.
Here's the moment that framed the whole month. On July 30 Microsoft reported fiscal Q4 revenue of $90 billion against the $87.7 billion the street wanted, with Azure growth of 43%. The stock closed up more than 15%, the largest single-day market-value gain any US company has ever posted. And still the index finished the month red. When your largest constituent has a record day and the tape goes nowhere, something underneath is being sold hard.
Thirteen basis points of index decline covered a 21.2% semiconductor drawdown
The S&P 500 went from 7,499.36 at the June close to 7,489.72 on July 31. That is a loss of thirteen basis points, which rounds to nothing on a monthly chart. Most readers will file it as a quiet summer month and move on.
But the internals were not quiet at all. The Nasdaq 100 dropped 6.61% over the same stretch, its worst month since March 2025. And the semiconductor basket, tracked by SOXX, fell from 640.76 to 504.89. That's a 21.2% drawdown in a single calendar month, in the sector that had led the entire 2026 advance.
So the index did not go sideways because nothing happened. It went sideways because two enormous moves cancelled each other out inside the same cap-weighted number. That is dispersion, and dispersion is what a rotation looks like from the outside.

Thirteen basis points. That's what the S&P 500 lost in a month that took a fifth off the semiconductor complex.
Nvidia finished July up 0.33% and Broadcom up 3.05%, which kills the AI-is-over story
Here is where the popular explanation falls apart. If July had been a verdict on artificial intelligence demand, the two largest AI compute names would have led the decline. They didn't. Nvidia closed the month up 0.33%, and Broadcom closed up 3.05%.
Both finished green while the sector around them lost a fifth of its value. That is not what a demand shock looks like. In a genuine AI unwind the compute suppliers get hit first and hardest, because they carry the highest expectations and the most crowded positioning.
Instead the selling concentrated somewhere very specific. Micron dropped 28.7% in July and SanDisk dropped 46.6%. On the equipment side KLA fell 39.4% and ASML fell 18.1%. Those are memory makers and the machines that make memory, so the market was not repricing AI. It was repricing the commodity layer that AI runs on.
We had part of this wrong going in. Through June we treated the chip complex as one position with one story, and July broke that assumption cleanly in half.
Micron's 28.7% fall and KLA's 39.4% fall trace the pain to memory and equipment
Memory is a commodity business wearing a technology badge. DRAM and NAND, the two chip types that store data rather than process it, get priced like copper rather than like software. Supply responds to price, margins compress on the way down, and every producer sells a nearly identical part.
The trigger was structural. Reports through late July said SK Hynix was slowing its expansion of high-bandwidth memory, the stacked chips that sit next to AI processors, and shifting capacity toward ordinary DRAM instead. Add broker work pointing to a memory price peak in 2027, plus fresh reporting on China's push into memory and lithography, and the whole commodity leg re-rated at once.
Translation: nobody decided AI was finished. The market decided that the parts anyone can eventually build are worth less than the parts only two companies can build.
Think of the AI build-out like a housing boom. The builders with signed contracts kept their margins intact, while the lumber yards found out that lumber is still lumber and a new sawmill opens the moment prices spike hard enough.
Microsoft added $450 billion in a day while holding capex at $175 billion for 2026
The capital spending line settles the argument. Microsoft did not trim its build-out when it reported on July 29. It guided to roughly $50 billion of capital expenditure for fiscal Q1 2027 and reaffirmed about $175 billion for calendar 2026, with Azure revenue crossing $100 billion for the first time.
So the money still flows. What changed in July is who gets to keep the margin on that money. Buyers of compute got re-rated upward, because Azure at 43% growth proves the spending converts into revenue. Sellers of undifferentiated inputs got re-rated downward, because their pricing power depends on a shortage that eventually ends.
Amazon told the same story on the last day of the month, closing Friday up 15.3% and finishing July up 14%. Meanwhile Alphabet ended July down 0.35% and Meta down 1.17%, both roughly flat, so this wasn't a blanket megacap bid either. It was specific to proven cloud conversion.
S&P 500 is one of the always-on assets on the Kunkel Capital rotation: members get the full structure map with entry, exit and invalidation refreshed on a fixed cycle.
$175 billion. Microsoft's calendar-2026 capex guide did not move, which is why the chip selloff cannot be a demand story.
Energy rose 12.1% and financials 6.2%, so the equal-weight S&P 500 gained 1.05%
Follow the money out of the chip complex and the rotation becomes obvious. Energy was the best sector in July, up 12.1%, and financials came second at 6.2%. Health care added 2.45% and staples 2.38%, while the tech sector fell 7.96%.
That mix tells you where the sellers went. Both leaders are short-duration, cash-heavy businesses that get better when rates stay high and oil stays bid, which is exactly the world the Fed described in July. The buyers weren't hiding, and they weren't in cash.
The cleanest proof sits in the equal-weight version of the same index. The S&P 500 equal-weight gained 1.05% in July, and the Dow added 0.32% for a fourth straight winning month. So the average S&P 500 company rose while the cap-weighted headline fell. If you only looked at the index print, you saw a quiet month; if you looked at the median stock, you saw a decent one.
One caveat worth naming: this rotation was not universal.

Small caps fell 3.08% and industrials fell 2.91%, so this was a move toward specific cash-flow profiles rather than a broad risk-on bid.
Warsh's 9-3 hold with three hike dissents repriced every far-dated earnings stream
Now the macro layer, because it explains the timing. On July 29 the Federal Reserve held the funds rate at 3.50% to 3.75%. The vote was 9-3, and all three dissenters wanted a quarter-point hike rather than a cut.
Those dissenters were Cleveland's Beth Hammack, Minneapolis's Neel Kashkari and Dallas's Lorie Logan. Their reasoning was plain: inflation has run above the 2% goal for more than five years, and Middle East energy prices have pushed it higher again. Chair Kevin Warsh reinforced the message afterward, calling elevated inflation unacceptable and repeating his pledge on price stability.
That matters for dispersion in a mechanical way. When the discount rate risk skews toward hikes, the assets that suffer most are the ones whose profits sit furthest out in time. Memory earnings for 2028 and equipment orders for 2029 get marked down harder than cash Microsoft collects this quarter. In plain terms, a hawkish Fed doesn't sell the index, it sorts the index.
Five numbers carry the whole month:
- -0.13%: S&P 500 monthly return, the first red July since 2014
- -21.2%: SOXX semiconductor decline, June close to July close
- +24.6%: Microsoft's July gain, including a record single-day move
- +12.1%: energy, the best-performing sector of the month
- 9-3: the FOMC vote on July 29, with all three dissents favoring a hike
Dispersion inside a holding structure, and where this thesis breaks
Here's the structural read. The S&P 500 spent July working between 7,313.92 and 7,581.50, and it closed at 7,489.72, which sits in the upper half of that range and well above the July low. An index that absorbs a 21% drawdown in its leadership sector and still holds the upper half of its monthly range is not distributing. It's rotating.
The wave logic follows the same shape. A correction that shows up as sector rotation rather than correlated selling behaves like a consolidation inside a larger advance, because the money leaving one leg lands in another rather than leaving equities altogether. Gold finished July up just 0.65% and the VIX closed near 16, so there was no flight to safety alongside the chip rout. That absence is the tell.
Where we are wrong is specific and observable. This read breaks if the S&P 500 takes out its July low on a monthly closing basis while Nvidia and Broadcom join the memory names on the downside. That combination would turn a margin rotation into a broad de-rating of the entire AI complex, and it would mean the discount-rate pressure has stopped sorting the index and started selling it.
The honest gap: we can't yet tell whether SK Hynix's decision on high-bandwidth memory is a capacity choice or an early demand signal. You get a first answer this week, because AMD and SanDisk both report and Friday brings the July jobs print with consensus near 85,000. Watch whether AMD's guide reads like Microsoft's or like Micron's.
Frequently asked questions
Why did the S&P 500 fall in July 2026 when Microsoft had a record day? Because the index is cap-weighted and two opposite moves cancelled. Microsoft's 24.6% July gain offset a 21.2% collapse in the semiconductor complex, leaving the index down 0.13% for the month.
Is the July semiconductor selloff a sign the AI trade is over? The data says no. Nvidia finished July up 0.33% and Broadcom up 3.05%, while memory and equipment names such as Micron, SanDisk and KLA carried the losses. AI compute held, and the commodity layer re-rated.
Did the average US stock fall in July 2026? No. The equal-weight S&P 500 rose 1.05% and the Dow added 0.32%, so the median company gained ground even as the cap-weighted headline finished red.
Why does a hawkish Fed hurt chip stocks more than software? Higher-for-longer rates discount distant profits harder than near ones. Memory and equipment earnings sit years out and swing with the cycle, so they get marked down twice while cash-generative software holds.
What breaks the constructive read on the S&P 500? A monthly close below the July low, combined with Nvidia and Broadcom breaking down alongside the memory names. That would mark a broad AI de-rating rather than a rotation.
Know your entry, your exit, and where you are wrong on the S&P 500
A 0.13% monthly loss that hides a 21.2% sector collapse is the surface signal. S&P 500 is on the Kunkel Capital watchlist: the full research maps the current wave count to a defined entry zone, an exit target and the exact invalidation level, refreshed on a fixed rotation, with alerts when levels hit. €19.99 first month, then €34.99. Cancel anytime.
Related Kunkel Capital research. On the memory leg, see Micron's DRAM contract-price gap. On equipment, see ASML's guide against the chip rout. On compute, see the AMD and Broadcom custom-silicon split. On the software side, see Microsoft's June gap shelf. On rate risk, see the Nasdaq 100 rate-hike scare. On the Fed, see Warsh, real yields and gold. On Friday's print, see the two-year yield's jobs-print pivot.
Sources: Federal Reserve FOMC statement (July 29, 2026), Microsoft fiscal Q4 2026 earnings release, Reuters, Bloomberg. Price data close-to-close via exchange feeds.
Last updated: 2026-08-03