Natural gas at $3.35 per MMBtu this week trades at its highest price since early February. MMBtu means one million British thermal units, the unit the US gas contract settles in. The crowd says summer gas is oversupplied, and storage still looks fat. But today's 10:30 a.m. ET report from the EIA (the US Energy Information Administration, which counts gas in storage every week) is about to erase the cushion everyone leaned on.
---
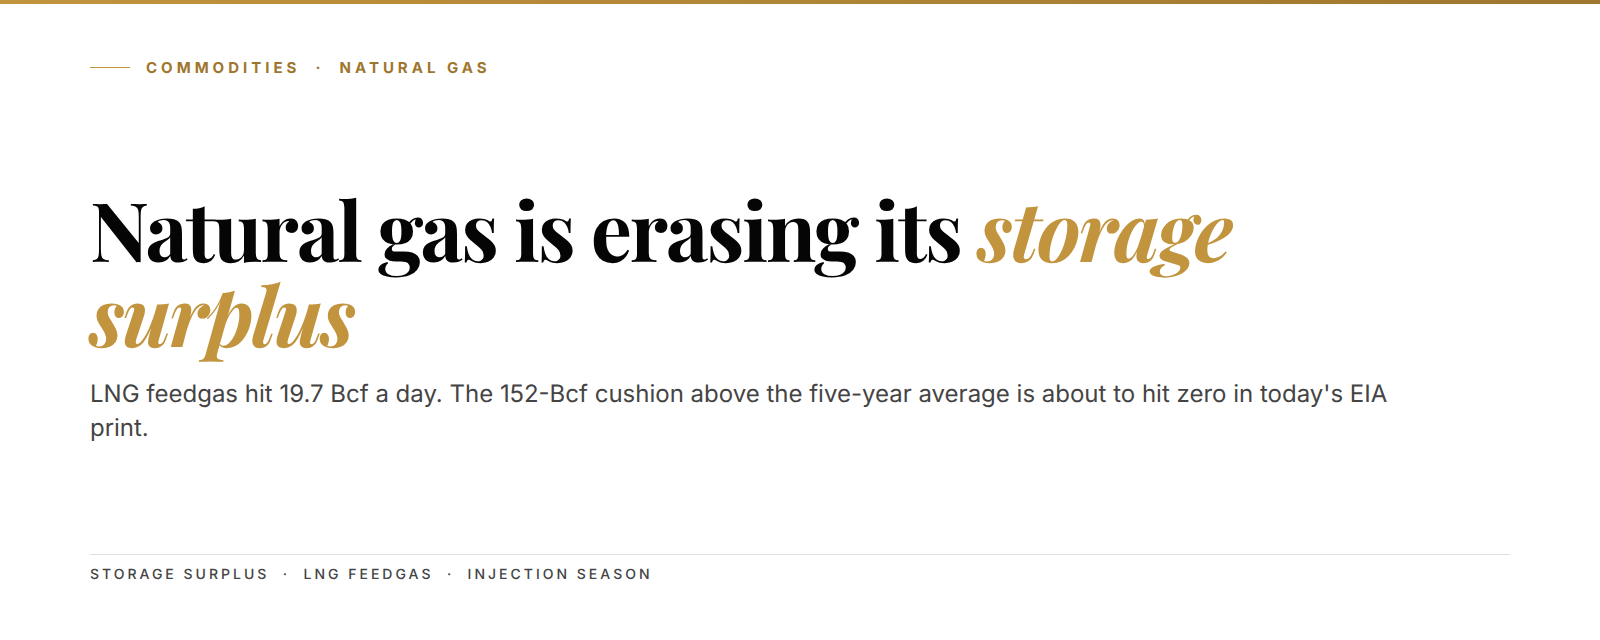
Here's the part the screen keeps hiding. The surplus to the five-year average has already fallen from 152 billion cubic feet toward zero in a matter of weeks.
The setup in 3 lines:
- Storage sat 152 Bcf above the five-year average on June 19. Forecasts put today's print near zero surplus.
- LNG feedgas hit 19.7 Bcf a day. That gas leaves the country. It never touches a US tank.
- Watch the $3.20 shelf on the August contract. It's bounced off the 50-day line nine sessions straight.
By 10:30 a.m. ET today, July 2, 2026, the EIA publishes the storage number for the week ending June 26. Every desk on the gas curve already modeled it, and most expect a print that wipes out the last of the surplus. That's the moment the summer story turns.
The five-year surplus disappears in today's 10:30 a.m. EIA print
The surplus everyone quoted is nearly gone. On June 19, US working gas in storage stood at 2.8 trillion cubic feet. That was 152 Bcf above the five-year average of 2,683 Bcf. It sounds comfortable, like a wall of supply that caps any rally.
But the surplus is a lagging number, and it's been shrinking fast. A year ago stocks sat higher, and now inventories run 1.7% below year-ago levels. The five-year cushion held on by a thread into late June.

The EIA's analysts hit publish at 10:30 a.m. ET every Thursday. Today's print covers the week ending June 26. Forecasts from the gas desks cluster around an injection small enough to drop the surplus to roughly the five-year line, and some models put it below.
Translation: the one bearish number the crowd kept citing is about to read like a normal year, not a glut.
That matters because price hasn't caught up to the balance yet. The August contract still trades like gas is heavy, and it isn't, not anymore.
LNG feedgas hit 19.7 Bcf a day, and that gas never comes back
One number explains most of the tightening. LNG feedgas hit 19.7 Bcf a day this week, the highest reading in more than two months, per BloombergNEF's flow tracker. Feedgas is the raw pipeline gas that export terminals chill into liquid and load onto tankers. Every unit that goes up that pipe leaves the country.
Think of an LNG terminal like a straw dropped into the national milkshake. Whatever goes up the straw and onto a ship can't refill the tank for winter. At nearly 20 Bcf a day, the pull is enormous, and it offsets a big chunk of the summer supply the bears keep pointing at.
Two terminals do most of the pulling. Venture Global's Plaquemines plant on the Louisiana coast and Cheniere's Corpus Christi Stage 3 in Texas have ramped hard this year. They don't take weekends off, and they don't care about the weather. The demand is structural, and it grinds every single day.
19.7 Bcf a day. That's export gas walking out the door before it can ever reach a storage tank.
Translation: a fifth of daily US output is now spoken for by ships, not by the domestic market. That's new, and it's the floor under this whole balance.

The heat wave through July 10 is the trigger, not the whole story
The spark this week is weather, and it's a real one. A severe heat wave is baking the country. Forecasters call for High to Very High demand through the July 4 weekend, with warm risk stretching to July 10. New York City is forecast to hit 100 degrees Fahrenheit, close to a mark set in 1966.
Here's why heat moves gas. Gas-fired power plants supply roughly 40% of US electricity. When the air conditioners all switch on at once, those plants burn more fuel to keep the grid up. That extra burn is called power burn, and it spikes with the temperature.
So the tape ripped. August natural gas settled up 9.4 cents, or 2.96%, on Tuesday, June 30. It was the ninth straight session the contract bounced off its 50-day moving average, the rolling average price traders use to read trend.
But weather is the trigger, not the thesis. Heat waves pass, and the gas you burn cooling a July afternoon is gone by August. If the story were only heat, you'd fade the pop and move on.
The heat matters because of what it does to the tank. Every hot day is a day storage refills more slowly, and that's how a short-term spark bleeds into the structural number.
Production at a two-month high is the real bear case
We'll be straight with you. The bear case is real, and it isn't going away. US dry-gas production climbed to a two-month high this week, with Lower 48 output near 110 Bcf a day. More gas out of the ground means more gas to inject, and that caps rallies.
Wait. That cuts against the bull read we just built. It does, and that's the honest tension in this market. Production is running hot enough that August futures stalled even with 100-degree heat in the forecast.
Here's how the two forces meet. Production adds gas to the balance, while LNG and power burn pull it out. Right now the pull is winning by a hair, which is why the surplus is vanishing instead of growing. But it's close.
Translation: strong supply is fighting strong demand to a near draw. The tie-breaker is the export straw, and that straw only gets bigger.
We don't know if today's print lands exactly at zero surplus or a touch above. Nobody does before 10:30. What we do know: the direction has been one way for six weeks, and the structural pull hasn't blinked.
Five numbers that define the July gas tape
Strip the noise. These are the figures that actually move the balance right now.
- 19.7 Bcf/day in LNG feedgas. The structural demand floor, and it's climbing.
- 152 Bcf surplus to the five-year average on June 19, on track to hit near zero today.
- 110 Bcf/day in Lower 48 production. The bear case, and it's real.
- 40% of US power comes from gas. That's why heat waves bite the balance.
- $3.20 on the August contract. The shelf that's held nine sessions running.
Keep that list next to the tape. When the surplus prints today, you'll know instantly whether the balance tightened or the bears got a reprieve.
Why this summer redraws the winter setup
The bigger point sits past this week. Gas is a seasonal game: you inject all summer to build a cushion for winter heating. The size of that cushion in late October sets the price ceiling for the cold months.
This is where the export straw changes the math. Every 20 Bcf a day that ships out is gas not going into the winter tank. If feedgas holds near 20 and climbs from there, the injection season ends lighter than the crowd expects. A thinner October tank means a jumpier winter.
That's the structural read our research has tracked all year. The LNG buildout turned a chronically oversupplied US market into a balanced one. It happened slowly, terminal by terminal, and the market keeps pricing the old world.
A thin October tank is a winter with no margin for error. That's the setup this hot, tight summer is quietly building.
You can see it in the year-on-year comparison. Stocks now sit 1.7% below where they were a year ago, even after a full spring of injections. The surplus that looked permanent in April is already gone.
Run the season forward. If injections stay light through August and September, the October tank lands under the comfort zone. Then one cold snap does real damage to price. The demand side keeps growing too, because new terminals keep switching on. The straw gets fatter every quarter, not thinner.
That's the shift most models are slow to price. They still treat LNG as a swing factor, and it isn't. It's baseload demand now, and it runs flat out.
The positional read: the $3.20 shelf and the surplus signal
Here's the level that matters. The August contract has bounced off its 50-day moving average for nine straight sessions, holding the $3.20 area. That's not random: it's buyers stepping in on every dip, treating weakness as a gift.
As of July 2, 2026, the read is simple. Hold above $3.20 with the surplus gone, and the burden of proof shifts to the bears. They need a production surge big enough to out-run both the heat and the export straw. That's a tall order in July.
The risk cuts both ways, and you should respect it. A cool-down after July 10 plus a production spike could knock the contract back through the shelf. Weather rallies fade fast. If the 50-day gives way on volume, the tightening story goes on hold.
So here's how we frame today's print. A near-zero or negative surplus with price holding $3.20 is the tightening case confirmed. A fat injection that rebuilds the surplus hands the bears the tape back. Either way, the number does the talking at 10:30.
That's the entire game right now. Supply versus the straw, with the tank as the scoreboard.
Frequently asked questions
What time does the EIA natural gas storage report come out? The EIA publishes its Weekly Natural Gas Storage Report at 10:30 a.m. ET every Thursday. Today's report, July 2, 2026, covers the week ending June 26.
Why is LNG feedgas so important for US gas prices? Feedgas is pipeline gas that export terminals turn into LNG and ship overseas. At 19.7 Bcf a day, it's gas that leaves the domestic market for good, so it tightens US supply and props up prices.
What is the five-year storage surplus? It's the gap between current gas in storage and the average for this week over the prior five years. A shrinking surplus signals a tighter market. Forecasts put today's print near zero surplus.
Does the summer heat wave change the winter outlook? Yes, indirectly. Hot summers slow the pace of storage refills. A lighter October tank leaves less cushion for winter heating, which can lift cold-season prices.
Where is the key level on natural gas right now? The August contract has held the $3.20 area, bouncing off its 50-day moving average nine sessions in a row. A hold keeps the tightening story alive, and a break puts it on hold.
See the full natural gas setup
The vanishing storage surplus and the 19.7 Bcf feedgas pull are the surface signal. The Kunkel Capital research adds the full injection-season model, the winter-tank projection with target zones, and the level map on the August and winter-strip contracts, updated as each Thursday print lands. €19.99 first month, then €34.99. Cancel anytime.
Related Kunkel Capital research on the energy tape. Start with our natural gas shoulder-season low setup and the shoulder-low post-mortem. On crude, see the draw-streak read and OPEC spare capacity after the UAE exit. For the curve, read Brent backwardation and tight physical crude. On positioning, check commercial net-long at commodity lows and copper's deficit and green demand.
Last updated: 2026-07-02