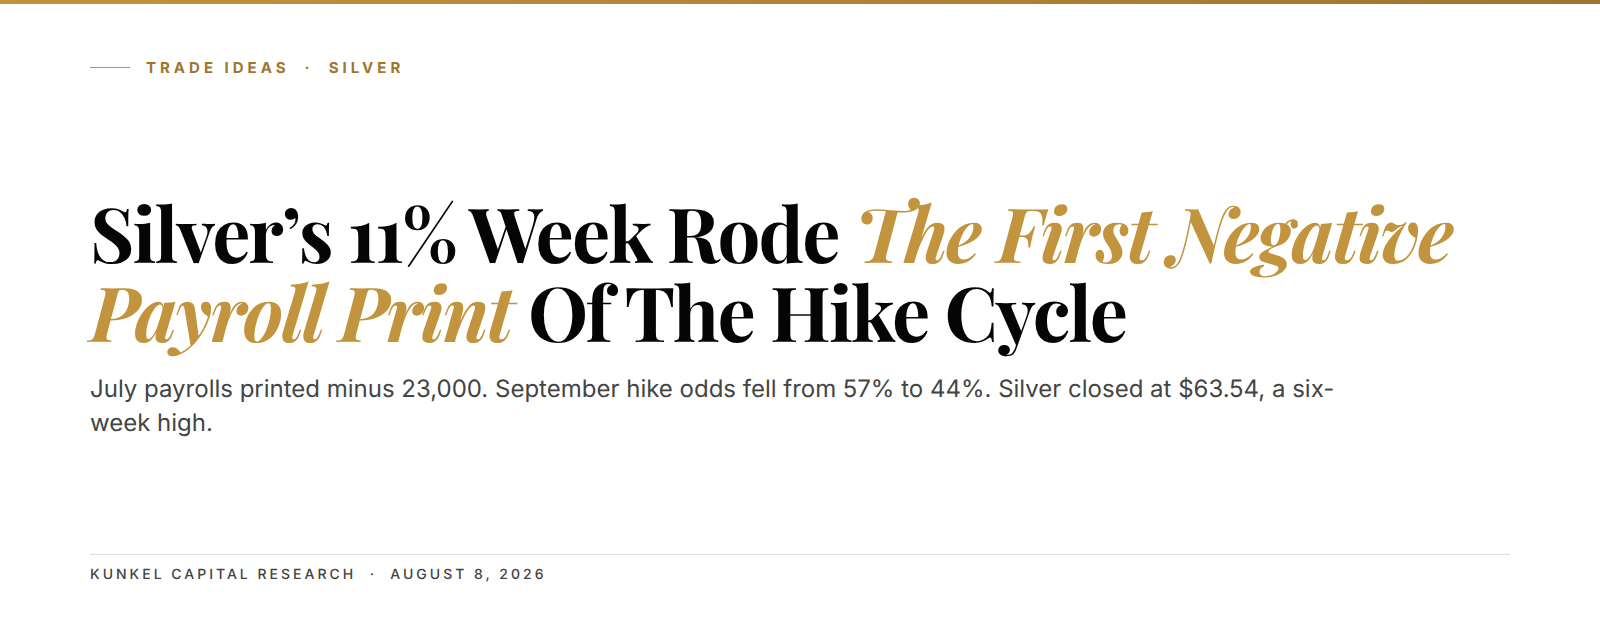
Silver closed at $63.54 an ounce on Friday, August 7, 2026, up 3.3% on the day and 11% on the week. That is its best finish in six weeks. The trigger wasn't a metals story at all. Nonfarm payrolls, the monthly count of jobs the US economy added or lost, fell by 23,000 in July. Forecasters had expected a gain near 80,000. For five months silver traded like a broken market, cut by more than half from its January record of $121.64. And the force that did the cutting, a Federal Reserve priced to keep hiking, lost its case in a single morning.
The setup in 3 lines:
- July payrolls printed minus 23,000 against a consensus near plus 80,000. September hike odds fell from 57% to 44% within hours.
- Silver runs on rate expectations harder than gold does. It beat gold this week and pulled the gold/silver ratio from 69 to 67.
- The structural question: is the 11% thrust off the July 16 low at $55 a new leg, or one more bounce?
At 8:30 a.m. Washington time on Friday, the Bureau of Labor Statistics published the July employment report. The revisions hurt more than the headline. May's gain was cut from 129,000 to 63,000, and June's from 57,000 to 20,000. So the labor market wasn't just weak in July. It had been fading for three months while the rate-hike trade kept running. Within hours, futures traders cut the odds of a September hike from 57% to 44%. The dollar slid to a two-week low, and silver went straight up.
A minus-23,000 payroll print did what six weeks of bounce attempts could not
Silver had been trying to base since mid-July, and every attempt stalled near the same shelf. Buyers kept probing the low 60s. Sellers kept leaning on the $63.30 area. The metal chopped sideways while the S&P 500 masked a much uglier July underneath. What changed on Friday wasn't the chart. It was the macro engine behind the chart.
Because the report missed in every direction that matters, the repricing was fast. Average hourly earnings rose just 3.2% over twelve months, the slowest wage growth since May 2021. That combination of shrinking payrolls and cooling wages is the opposite of the overheating story the Fed had been hiking against. Silver touched $65.05 in the morning session before settling at $63.54. The weekly gain reached 11%.
Translation: the data series the Fed watches most just flipped sides. The metal most punished by the hiking cycle got the biggest bid.
To be fair, one piece of the report doesn't fit the gloom. The unemployment rate actually fell to 4.1%. That figure comes from a separate household survey, and it softens the recession read. We'd rather flag that wrinkle than pretend the print was clean. But rate markets vote with positioning, and positioning moved 13 points of hike probability in one session.

September hike odds at 44% flip the force that crushed silver all year
Here is the mechanism, in plain terms. Silver pays no yield, so every rate hike raises the cost of holding it instead of cash. Think of the hiking cycle as a hand holding a beach ball underwater. The ball never stops wanting to float. But it can't surface until the hand eases. Friday's report was the hand slipping.
That same pressure ran through every asset we cover this summer. The Nasdaq 100 took the first rate-hike scare of a cycle priced for cuts in late July, and Bitcoin ground through a three-dissent Fed with its $60,000 floor intact. Silver just expresses the rate story with more torque. It's a smaller market than gold with a heavier industrial base, so the same impulse travels further in price.
You can see the torque in the gold/silver ratio, which measures how many ounces of silver one ounce of gold buys. The ratio compressed from about 69 to 67 this week as silver outran gold's own surge toward $4,350. When both metals rally and the ratio falls, the market isn't just hedging fear. It's positioning for the rate regime itself to turn. That's a different, and stronger, kind of bid.
57% to 44% in one morning. The September hike odds move on August 7 was the fastest single-day repricing of Fed expectations since the hiking cycle began.
Silver's 48% collapse from $121.64 was the same rate story running in reverse
Rewind seven months to see why this print matters here. Silver peaked at $121.64 in January 2026, a record, at the top of a parabolic run. From there it fell for five months in a series of overlapping declines. We read that choppy, grinding shape as corrective rather than impulsive (a countertrend rest, not a new bear trend). The slide ended with capitulation at $55 on July 16. That's a 48% drawdown top to bottom. And it tracked the repricing toward more hikes almost tick for tick.
The shape of the decline is the load-bearing detail here. Overlapping legs down, each one bought and then resold, are how markets correct a mania without ending a secular trend. Even at the July low, silver still traded 66% above its level from a year earlier. So the crash removed the froth of the January parabola, but it never broke the multi-year advance underneath. From there, the rebound has covered $55 to $63.54 in three weeks.

$55 to $63.54 in three weeks. The rebound off the July 16 capitulation low has already retraced the entire June-July leg of the decline.
The character of that rebound separates it from the failed bounces of spring. Those earlier rallies faded in days on falling volume, and each one rolled over below the prior high. This one has accelerated into resistance instead. Friday's session cleared the $63.30 shelf that had capped price since late June. Structure-wise, a thrust like this off a seven-month low is how new legs announce themselves.
Chinese ore imports rose through the entire drawdown, and the divergence finally mattered
While the paper price was being cut in half, the physical side never confirmed the bear case. Chinese imports of silver-bearing ores surged year over year in June. The buyers are solar panel makers and the country's electricity grid build-out. In other words, the biggest industrial buyer on the planet treated the entire decline as a discount window. That divergence between falling price and rising offtake was the setup. Friday's macro flip is what released it.
Meanwhile, the war-premium channel that dominated metals headlines all summer is fading as a driver. Gold's four-day rally into the Hormuz peace deal killed the war-hedge story, and crude's reaction to Iran's restrictive draft showed the reopening was never a round trip. Silver barely joined the fear bid on the way up. That means it has little fear premium to give back now. Its Friday move was built on rates and jobs, the sturdier fuel.
Here is the week in five numbers:
- Minus 23,000: July nonfarm payrolls, in a month when consensus expected a gain near plus 80,000.
- 44%: September hike odds by Friday afternoon, down from 57% before the report.
- 3.2%: twelve-month wage growth, the slowest since May 2021.
- 67: the gold/silver ratio, compressed from 69 a week earlier.
- 11%: silver's weekly gain, its largest of 2026 so far.
An 11% weekly thrust off a seven-month low changes the burden of proof
Put the pieces in order and the read resolves cleanly. A five-month corrective decline ended in capitulation at $55 on July 16. Physical demand rose through the whole drawdown. Then the macro force behind the correction, an expanding rate-hike path, broke on a negative payroll print. The metal answered with an 11% weekly thrust through the $63.30 shelf. The burden of proof now sits with the bears. They need the labor data to reverse and hike odds to rebuild, because the price structure no longer argues their case for them.
There's an honest uncertainty in that read, and we'd rather name it than hide it. One payroll report doesn't make a regime, and consensus forecasts still sit near $59.66 for Q3, below spot. If August's report snaps back the way Bitcoin's pre-Fed slide reversed in July, some of Friday's repricing unwinds with it. The structural read survives a pullback; it does not survive a re-armed Fed.
So here is where the thesis breaks. A weekly close back below the round 60 handle, with hike odds rebuilding above 50%, would mark this as one more corrective bounce. That's the condition we're watching, and it's observable on any free chart. Silver is one of the assets on the Kunkel Capital rotation: members get the full structure map with entry, exit and invalidation refreshed on a fixed cycle.
If you trade silver, the practical takeaway is a simple hierarchy. The jobs data now outranks the Middle East headlines. The weekly close outranks the intraday noise. And the $55 low is the line the whole recovery is built on. Keep an eye on the gold/silver ratio as well. Continued compression against gold would confirm the rate-regime read. A sudden expansion would warn that fear, not rates, is back in charge.
Frequently asked questions
Why is silver up today?
Silver rose 3.3% to $63.54 on Friday, August 7, 2026. The July jobs report showed the US economy lost 23,000 jobs against forecasts near plus 80,000. The miss cut September hike odds from 57% to 44% and weakened the dollar, and non-yielding metals caught the bid.
Is silver's rally different from gold's?
Yes, in one measurable way. The gold/silver ratio compressed from 69 to 67 this week, which means silver outperformed even as gold hit $4,350. Ratio compression during a joint rally points to rate positioning rather than pure fear hedging.
What levels matter for silver right now?
Start with the market-visible ones. The July 16 capitulation low sits at $55, the shelf that broke on Friday sits at $63.30, and the January record sits at $121.64. The round $60 area is the floor the recovery structure is built on.
Could the silver rally fail?
It could, and the condition is observable. A weekly close back below the round 60 handle while September hike odds rebuild above 50% would turn the read back to corrective. A single hot jobs report in September is the most likely trigger for that reversal.
Does industrial demand support silver in 2026?
Yes, and it never stopped. Chinese imports of silver-bearing ores rose year over year in June, driven by solar manufacturing and grid expansion. That buying continued through the entire price decline, which favored the recovery case.
Know your entry, your exit, and where you are wrong on Silver
The jobs-print breakout is the surface signal. Silver is on the Kunkel Capital watchlist. The full research maps the current wave count to a defined entry zone, an exit level and the exact invalidation point, refreshed on a fixed rotation, with alerts when levels hit. €19.99 first month, then €34.99. Cancel anytime.
Sources: Bureau of Labor Statistics July 2026 Employment Situation; CME FedWatch rate-probability data; Chinese customs import data via Reuters; World Gold Council market data.
Last updated: 2026-08-08