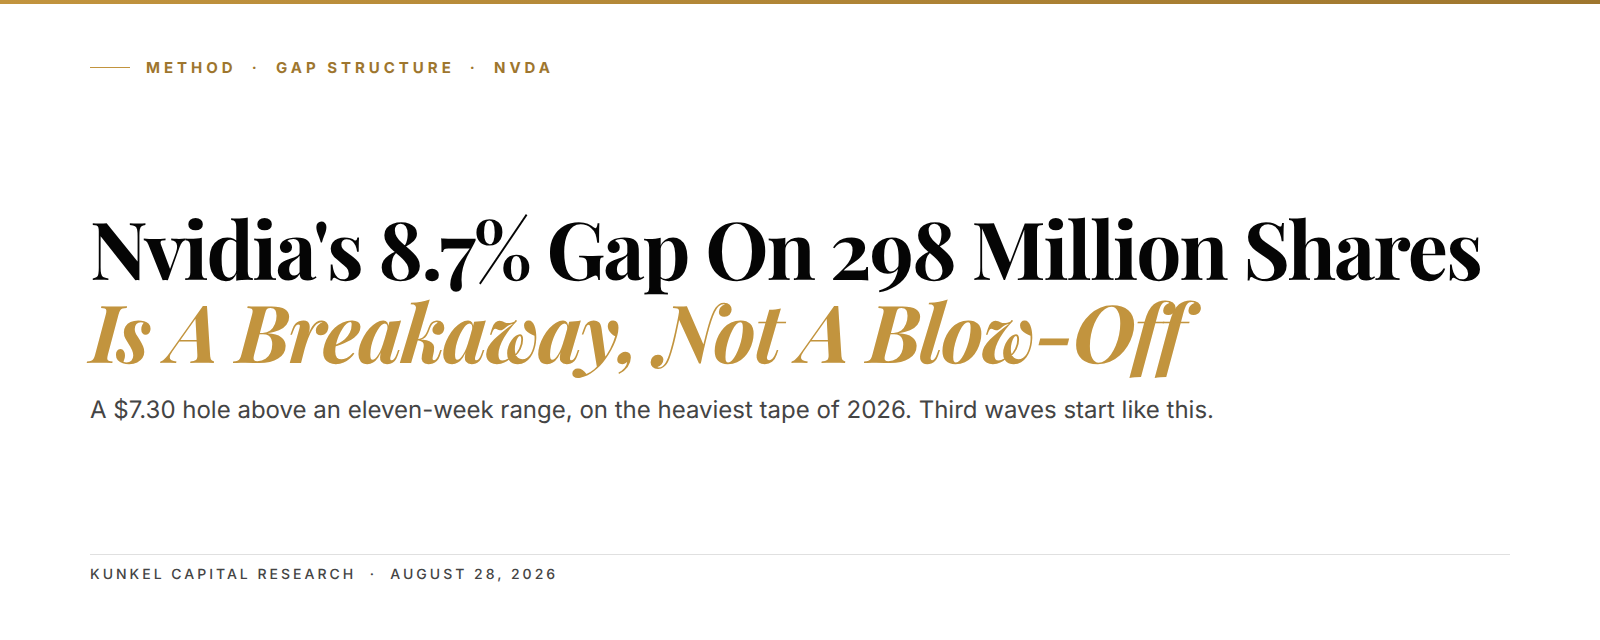
Nvidia gapped 8.7% higher on Thursday, August 27. The Q2 print showed $96.2 billion in revenue and a $108 billion guide for the current quarter. Going into the call, the consensus was simple: four straight post-earnings drawdowns had taught the tape to sell a beat. That pattern broke on the fifth try. And it broke on 298 million shares, the heaviest session of the year. In plain terms, the gap is the first price evidence since May that the June-July correction is over.
The setup in 3 lines:
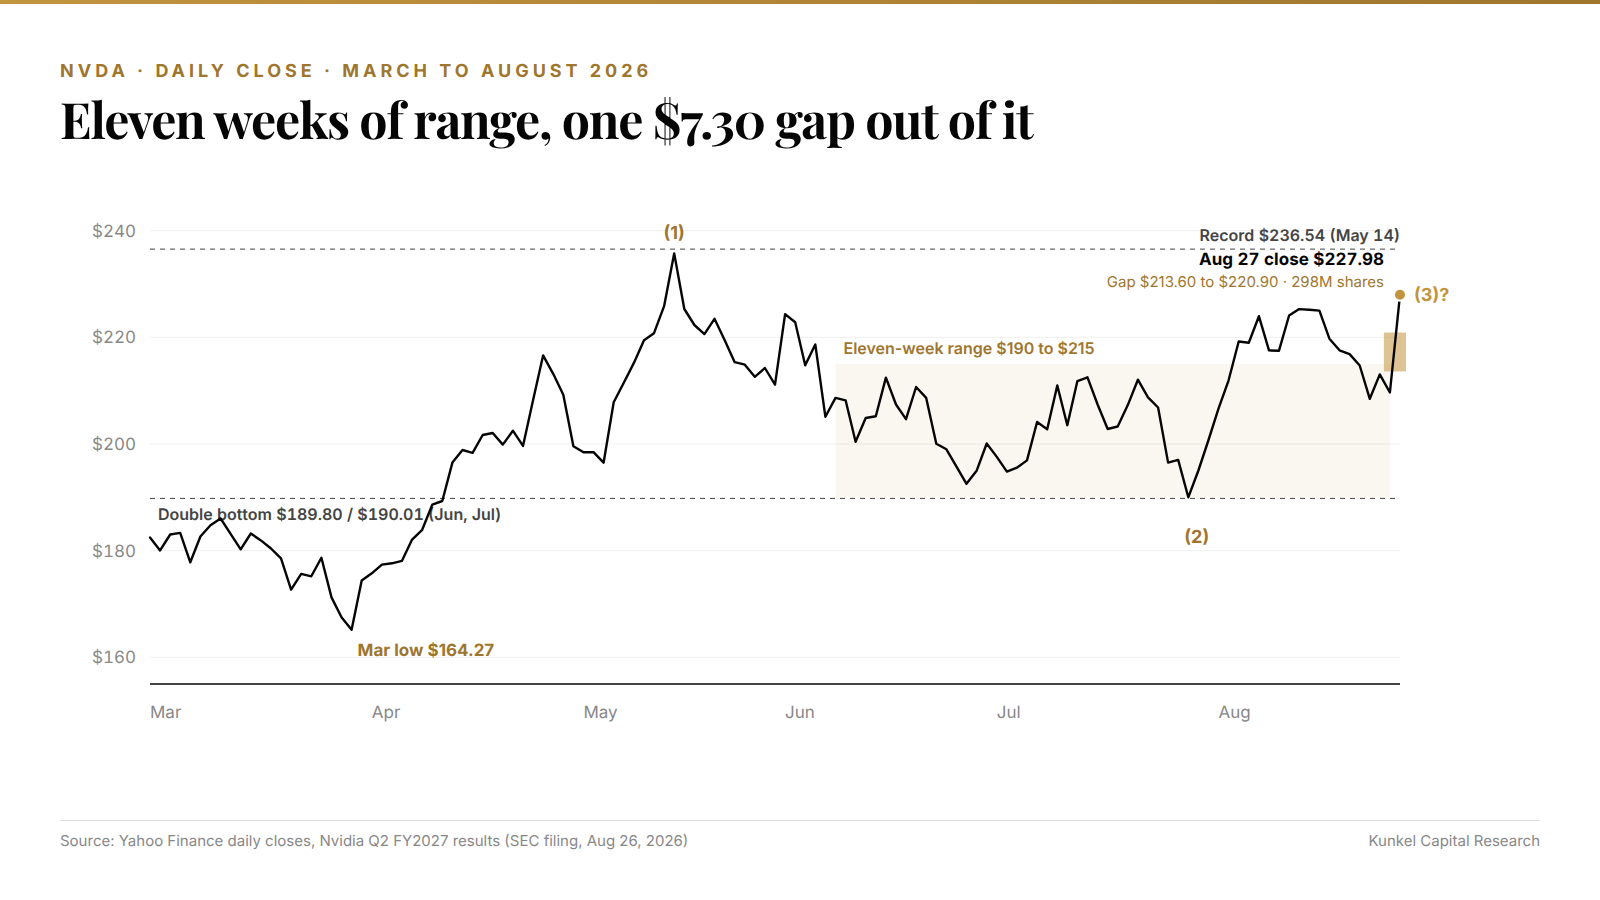
- NVDA closed at $227.98 on August 27, up from $209.66, leaving a $7.30 open gap between the Aug 26 high and the Aug 27 low.
- Breakaway gaps out of a three-month range on record volume are the signature of a third wave starting, not a rally ending.
- The read holds as long as the gap stays open; a close back inside it on rising volume flips the label to exhaustion.
At 17:03 ET on Wednesday, Colette Kress told analysts that Vera Rubin would be "the fastest product ramp in Nvidia's history." The after-hours tape had dipped red in the first minute. After that sentence it turned and stayed bid. That one line did more work than the beat itself, because it answered what the four prior sell-offs were really asking: does growth decelerate from here, or does it just change product?
Nvidia's $7.30 gap landed above three months of failed rallies
The correction started at the May 14 record of $236.54 and ran for eleven weeks. June printed a low at $189.80, and July retested it at $190.01. Every bounce between those two lows died somewhere under $215. So the range that mattered into the print was roughly $190 to $215, with the mid-August highs at $227.92 as the last ceiling before the record.
Thursday's open at $222.86 cleared that whole zone in one tick. The stock never traded below $220.90 all day. That means the entire Aug 26 candle (high $213.60) sits below Thursday's low, which is the definition of a gap. The $7.30 hole between $213.60 and $220.90 is a level every free chart shows. By the close, NVDA sat six cents above the August 17 swing high, so the gap didn't just leave the range behind, it also reclaimed the last lower high.
Think of a range like a crowded stairwell. For three months, buyers and sellers agreed on the floor and the ceiling, and each rally got sold into the same overhead. A gap takes the stairwell away. Nobody who wanted to sell at $215 got the chance, so those sellers are now either chasing or sitting on an offside short. Both groups add fuel.
Four sell-the-news prints in a row made the fifth one the trap
Since the April 2025 quarter, every Nvidia earnings reaction had been red. Our May post on the $75 billion data center quarter framed that streak as the setup and looked for a shallow Wave 4 to hold the $217 shelf. Wait, actually, that read was wrong on depth. The correction ran to $190, a full 64% retracement of the March-to-May leg. That is far too deep for a fourth wave, which rarely gives back more than 38% of the third.
So the count had to be relabelled. The March low at $164.27 to the May high reads better as a complete impulse of one degree. The June-July drop is then the second wave that follows it. Second waves routinely retrace 50% to 62% of the first wave, and they often end on a double bottom. June and July printed exactly that. The relabel matters because the wave after a completed second wave is a third, and third waves are where the textbook expects gaps and volume expansions.
The sell-the-news streak fits the same logic. Four straight post-earnings drawdowns are what a corrective phase looks like from the inside: strong numbers, weak follow-through, sentiment cut loose from fundamentals. Then the fifth print gaps higher on the year's heaviest volume. That reads as the crowd that learned to sell beats getting run over by the crowd that stopped waiting.
298 million shares is the volume signature of a breakaway gap, not exhaustion
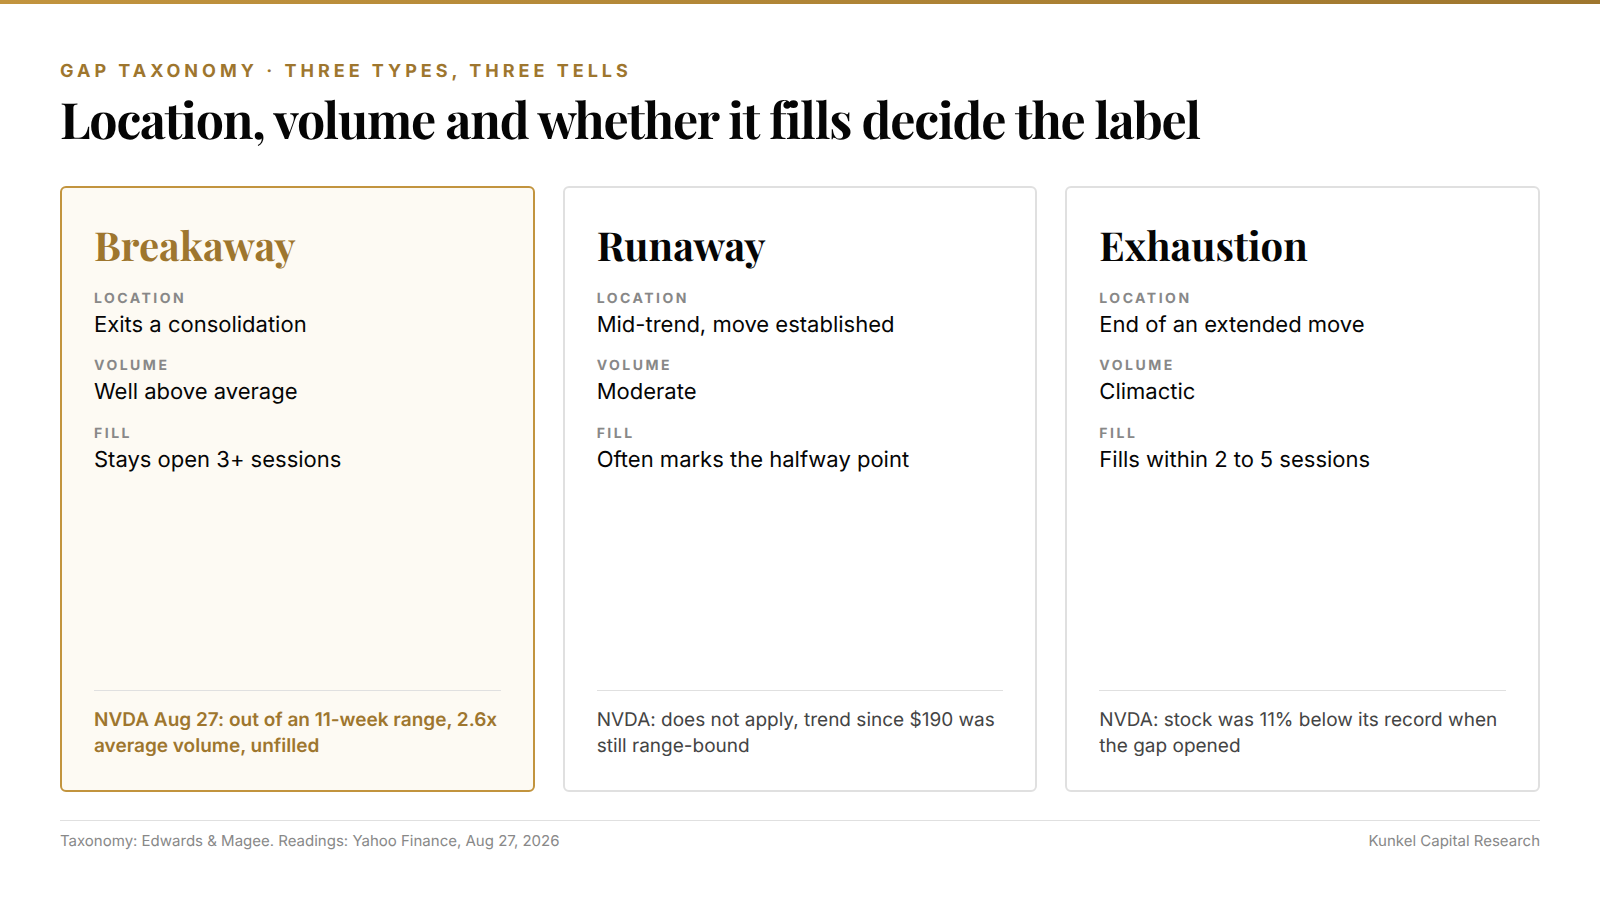
Gaps come in three kinds, and the difference between them is the whole trade. The taxonomy below is the standard one from Edwards and Magee. We've added what the NVDA tape printed on each test.
- Breakaway gap: forms at the exit of a consolidation, on volume well above average, and usually stays open for the first few sessions. NVDA: out of an eleven-week range, 298 million shares against a 30-day average near 115 million, unfilled as of Friday.
- Runaway (measuring) gap: forms mid-trend after a move is established, on moderate volume, and often marks the halfway point. NVDA: doesn't apply yet, because the trend since $190 was still range-bound when the gap printed.
- Exhaustion gap: forms after an extended move, on climactic volume, and fills within two to five sessions as the last buyers get trapped. NVDA: doesn't fit, because the stock was 11% below its record when the gap opened.
- Common gap: forms inside a range, on ordinary volume, and fills fast with no structural meaning. NVDA: the Aug 24 drop to $208.48 was this type, filled within two sessions.
- The tiebreaker: the first three sessions after the gap. A breakaway stays open and an exhaustion gap fills. It is the only diagnostic that costs nothing to wait for.
Translation: a gap on record volume that exits a range and holds for three days is a breakaway, and a breakaway is how third waves announce themselves.
298 million shares. The heaviest NVDA session of 2026, and 2.6 times the 30-day average, on a day the stock gapped out of an eleven-week range.
One thing gives us pause, and that is the day's range. Thursday's high of $230.47 faded to a $227.98 close, a 1.1% give-back from the peak. That's normal for a gap day. The close also held above the August 17 high. But a wide-range day that closes off its highs always earns a second look. You want the next two sessions to hold the gap without another push, because a chase to $236 on day two would look more like exhaustion than base-building.
The June double bottom at $190 held where the March-to-May leg said it should
The correction's depth is the part most coverage skips. It's also the part that makes the breakaway read stronger, not weaker. The March low at $164.27 to the May record was a $72 leg, and the June low at $189.80 gave back a bit under two-thirds of it. Second waves that retrace that much usually end on a test rather than a single spike. The July retest at $190.01 came within 21 cents of the June print.
Which just means the correction did its job. A second wave is supposed to retrace deep enough to convince everyone the first leg was a fluke, then hold. The $190 floor is market-visible on every chart. It held twice, seven weeks apart, and that is what turns the August gap from a squeeze into a structural signal. A gap out of a range with no tested floor beneath it is a coin flip, but a gap out of a range that sits on a double bottom has a base.
Nvidia is one of the assets on the Kunkel Capital rotation: members get the full structure map with entry, exit and invalidation refreshed on a fixed cycle. What the public chart gives you is the shape. From the $190 double bottom to the $7.30 breakaway gap, the sequence is a clean wave-two-into-wave-three handoff. The only public levels that matter are the ones the tape already printed: $189.80, $213.60, $220.90, $227.92 and $236.54.
Memory supply through fiscal 2028 is the fundamental that keeps a third wave fed
Third waves need a story that hasn't been priced, and the story on this call was capacity, not demand. Kress said supply would "remain a bottleneck, at least through end of fiscal year 28." The filing shows purchase commitments jumping to $279 billion through 2032, up from $119 billion a quarter ago. Most of that is memory. In other words, the company just prepaid for two years of the input everyone assumed would be the choke point.
That commitment changes how the guide should be read. The $108 billion Q3 number implies growth in the mid-to-high 80% range, down from 106%. That deceleration is what the bears leaned on in May. But a guide capped by supply doesn't decelerate the way a guide capped by demand does. Jensen Huang said "our demand is much higher" and asked for "the help of the entire supply chain." That is a CEO asking for more input, which is not what a company at the top of a cycle says.
Vera Rubin adds the product-cycle piece. Production shipments started in early August, and orders are in from every major hyperscaler. Kress guided the new platform to roughly 20% of Q3 data center revenue. Put simply, the mix shift is landing one quarter earlier than the Street had it. And the memory commitments say the ramp won't be starved. The same bottleneck that squeezed Micron's tape into a rebound is the one Nvidia just paid to lock.
Where the breakaway read is wrong
Every structure has a condition that breaks it. This one is unusually clean, because the gap draws the line for you. The thesis breaks if NVDA prints a daily close back inside the gap, below the Aug 26 high of $213.60, on volume that expands into the decline. That behavior would relabel Thursday as an exhaustion gap. It would also reopen the four-month range and put the $190 double bottom back on the table as a third test.
Short of that, the read stays intact even through noisy sessions. A pullback that tags the top of the gap and holds is normal third-wave behavior, since the gap edge is where trapped sellers meet new buyers. Even a retest of $220 on light volume wouldn't change the label. The distinction is between a gap that gets tested and a gap that gets closed. Only the second one is where we are wrong.
The macro backdrop is the acknowledged uncertainty. Thursday's PCE print came in at 3.7% headline and 3.3% core, and the 10-year sits at 4.686%. Kansas City Fed President Jeffrey Schmid said inflation is still too high. Kevin Warsh speaks at Jackson Hole on Friday. A hawkish surprise there could compress the whole tape, and a stock that gapped 8.7% into a rate scare has air under it. We can't see that path in the price yet, so we don't count it. But it's the exogenous risk we'd name first.
So here is where the whole read resolves. The August 27 gap is a breakaway on the volume and the location. The June-July double bottom is a completed second wave on the depth and the retest. Together they point to a third wave that has just started, not a rally that has just finished. What the full research adds is where inside that structure the entry sits, where the exit lands, and the exact price where the count fails.
Frequently asked questions
Why did Nvidia stock gap up 8.7% on August 27, 2026?
Nvidia reported Q2 FY2027 revenue of $96.2 billion against a $92.4 billion estimate and guided Q3 to $108 billion. It also said Vera Rubin shipments had started with orders from every major hyperscaler. The stock opened at $222.86 after closing at $209.66 the day before.
Is the Nvidia earnings gap a breakaway gap or an exhaustion gap?
On the evidence so far it's a breakaway. It exited an eleven-week range, printed on 298 million shares (2.6 times the 30-day average), and stayed open. An exhaustion gap forms at the end of an extended move and fills within two to five sessions. NVDA was 11% below its record when the gap opened.
What is the Elliott Wave count on NVDA after the August 2026 earnings?
The March low to the May record reads as a completed first wave. The June-July double bottom at $190 is the second wave, a 64% retracement. The August gap is the start of a third wave, which is where Elliott's rules expect gaps and volume expansion.
What would prove the bullish Nvidia read wrong?
A daily close back inside the gap, below the August 26 high of $213.60, on rising volume. That would relabel the gap as exhaustion and reopen the range.
Does Nvidia's slower growth guide matter for the chart?
The Q3 guide implies growth in the mid-to-high 80% range versus 106% last quarter. But Kress tied the constraint to memory supply through fiscal 2028, and purchase commitments rose to $279 billion. A supply-limited guide is a different thing from a demand-limited one.
Related reading
- Why Wave 3 extensions catch traders offside.
- Our May read on Nvidia's fourth sell-the-news.
- Micron's rebound on the memory bottleneck.
- TSMC's record quarter and the Wave 4 pullback.
- Alibaba's earnings gap reversal test.
- Wave 4 pullbacks and channel alternation.
- The circular-financing question on Nvidia and OpenAI.
Know your entry, your exit, and where you are wrong on Nvidia
The $7.30 breakaway gap is the surface signal. Nvidia is on the Kunkel Capital watchlist: the full research maps the current wave count to a defined entry zone, an exit target and the exact invalidation level, refreshed on a fixed rotation, with alerts when levels hit. €19.99 first month, then €34.99. Cancel anytime.
Sources: Nvidia Q2 FY2027 results and earnings call (SEC filing, August 26, 2026), Reuters, Bloomberg, Yahoo Finance price data.
Last updated: 2026-08-28