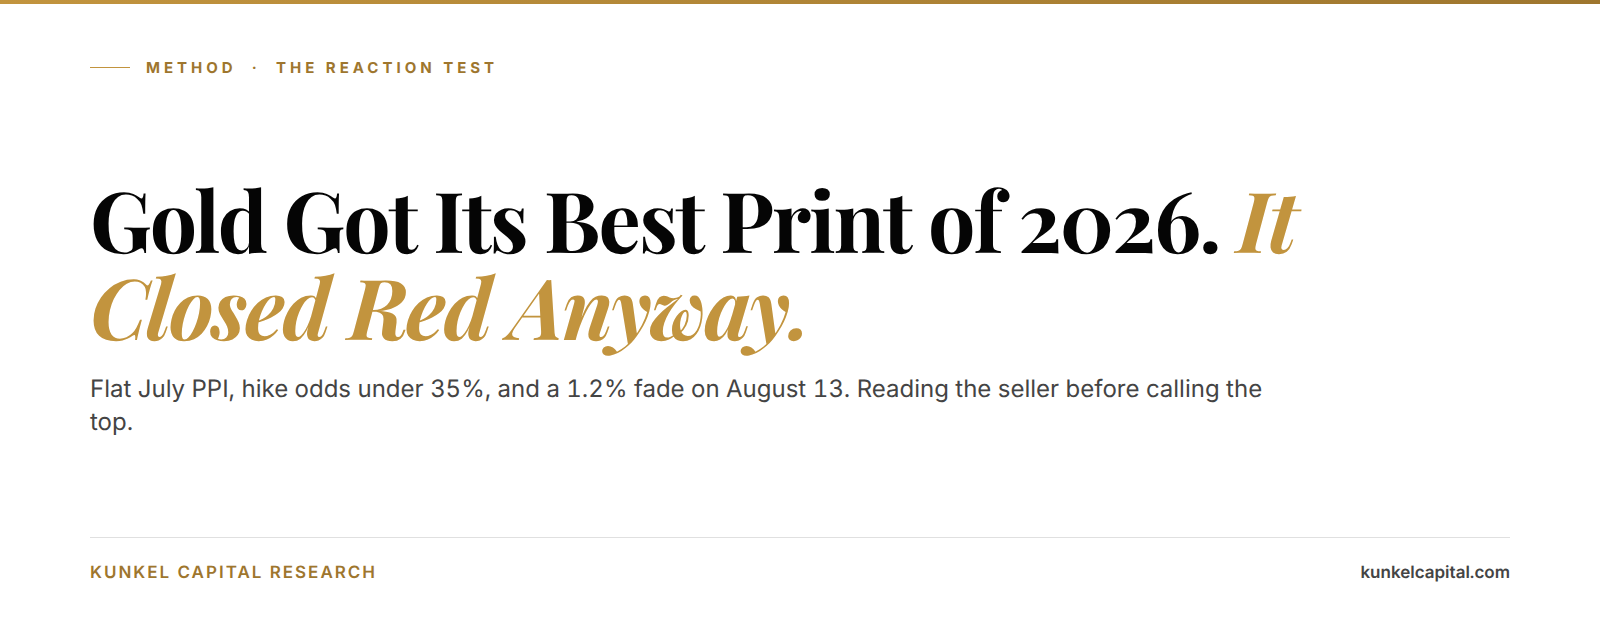
Gold closed near $4,354 on Thursday, down 1.2 percent, hours after the softest wholesale inflation print of 2026. July producer prices came in flat against a 0.2 percent consensus, the second cooling inflation report in 24 hours, and futures markets cut September rate-hike odds to under 35 percent. That is close to the best rates news this rally has seen all year. Consensus says a market that falls on good news is exhausted. The tape says something more specific, and the difference is worth money.
The setup in 3 lines:
- July CPI on Wednesday and a flat July PPI on Thursday, August 13, cut September hike odds from 55 percent to under 35 percent inside a week.
- Gold still fell 1.2 percent on Thursday, its first red close after four straight opens above the $4,400 handle.
- The seller wasn't the rates market: Brent dropped 2.2 percent the same day, and the war-premium leg of gold's advance deflated with it.
---
Start with the stat that breaks the lazy read. Gold is up 9.5 percent in a month and 33 percent in a year, and Thursday delivered the friendliest macro print of that entire stretch. A market that tops on its own best news is a real warning, so the exhaustion call deserves a hearing. But before you accept it, you have to check who was actually selling. On Thursday, the answer sits in a different market.
Two cooling prints in 24 hours took September hike odds under 35 percent
Wednesday's consumer price report set the stage. July CPI rose 0.1 percent on the month, which pulled the annual rate down to 3.4 percent from 3.5 in June. Core prices, the basket without food and energy, slowed to 2.5 percent year over year.
The internals mattered more than the headline. Shelter did about two thirds of the monthly increase, while the energy index fell 1.5 percent on the month. In plain terms, the energy shock that spent the first half of 2026 pushing inflation around is now working in reverse.
Then Thursday morning pushed the story further. The Bureau of Labor Statistics published the July Producer Price Index, the prices businesses charge before goods ever reach a shelf, and the consensus looked for a 0.2 percent rise. The print came in flat, and the annual rate dropped to 4.7 percent from 5.5 percent in June.
Wholesale gasoline did most of that work, falling 5.7 percent and accounting for over half the goods-side decline. So the pipeline is cooling from the front, which is why futures pricing marked September hike odds below 35 percent after 55 percent a week earlier. Equities took the print at face value, and the S&P 500 cleared 7,800 for the first time the same afternoon.
Gold fell 1.2 percent anyway, and the fade has a named author
December futures opened at $4,468.80 on Thursday, the fourth straight session opening above the $4,400 handle. By the close, spot had slipped 1.2 percent to roughly $4,354. The week's 4 percent gain survived, but the day printed red.
The easy explanation writes itself. After 9.5 percent in a month, the rally finally got its good news, sellers used the liquidity, and the move is done. That pattern is real, and after a 33 percent year it deserves respect. But it has a testable fingerprint, and Thursday doesn't match it.
Because gold didn't fall alone on Thursday. Brent crude dropped 2.2 percent to settle at $87.07, and WTI lost 2.4 percent in the same session. Crude had its own named author that day. US Energy Secretary Chris Wright told reporters that crude exports through the Strait of Hormuz are running near 9 million barrels a day, well above what independent trackers had assumed.
Traders heard fewer stranded barrels and hit oil within the session, even though Iran and Oman still haven't agreed on reopening the waterway and ships keep getting attacked. That matters for gold because a slice of its advance is the same insurance premium, the war-hedge bid we mapped when gold rallied on the Hormuz peace headlines in early August. When the premium bleeds out of crude, it bleeds out of the hedge too.
55 percent to under 35. September hike odds collapsed inside a week, gold closed red anyway, and that mismatch is the entire story.
The reaction test reads the seller, not the headline
The reaction test compares what a market should do on a given print with what it actually does, and treats the gap as information about drivers and positioning. Old floor traders ran a version of it as effort versus result, a Wyckoff-school habit: favorable news is the effort, the close is the result. When the result lags the effort, something is pushing back, and your job is to name it before declaring the trend dead.
Think of it like flooring the accelerator in a loaded truck. If the pedal goes down and the truck barely speeds up, you haven't learned anything bad about the engine. You've learned the load changed, and that is a different problem with a different fix.
Run the test in five steps:
- Name the engines. Write down the two or three drivers actually carrying the trend, which for gold right now are the hike-off repricing and the Hormuz war hedge.
- Score the print against expectations, not against fear. A flat PPI versus a 0.2 percent consensus scores as genuinely good for gold.
- Take the close, not the first tick. Algorithms trade the headline in milliseconds, but positioning shows up by the settle.
- Attribute the fade. Did the asset fall alone, or did a correlated driver fall with it? Falling alone smells like distribution, falling together reads as rotation.
- Repeat for two or three sessions, because one day is a data point and three days are a verdict.
Translation: good news plus a red close isn't automatically a top. It's an instruction to find the seller.

Thursday's attribution points at the war leg, not the rates leg
Apply step four and the picture sharpens fast. Gold's advance since June has run on those two engines, and Thursday strengthened one while the other lost thrust. The rates engine got its second cooling print in 24 hours, yet crude bled more than 2 percent on the export claim, dragging the shared war premium down with it.
So the metal gave back 1.2 percent while its most correlated driver gave back more. That is rotation between drivers, not rejection of the trend.

A genuine top on good news would look different: gold down hard on a day oil holds its bid and yields sit still. We ran the same attribution logic on crude itself earlier this week, when five green sessions arrived without a single new war headline, and the answer there pointed at published supply math instead of fear. Same test, opposite conclusion, which is the point of having a test.
There's a second, quieter weight on Thursday's tape. A record-setting equity session pulls capital toward risk, and safe-haven assets lose a little bid every time stocks sprint. Bitcoin, sitting near $63,500 and red for the week, shows the same hedge-side heaviness while the S&P celebrates.
And we'll flag the honest wrinkle ourselves: after a 9.5 percent month, some of Thursday's selling was surely plain profit-taking. No decomposition can cleanly separate that from the war-premium bleed, and the test doesn't claim to. It claims the burden of proof, and one oil-led red close doesn't meet it.
Gold is one of the assets on the Kunkel Capital rotation: members get the full structure map with entry, exit and invalidation levels refreshed on a fixed cycle.
Structure says corrective until the fades lose their excuse
In wave terms, a sharp one-session dip with a nameable external author tends to print as corrective: an overlapping three-swing affair that holds above the shelf where the breakout happened. The count behind that read, and the Fibonacci confluence work that prices it, is product territory. The character of the dip is not, because you can see it on any free chart.
Distribution carries a different signature, because it grinds. You see repeated red closes without an external excuse, friendly prints ignored twice and then three times, and volume building on the down days. At the end of that sequence, the handle that held every open finally gives way at a close rather than an open.
So far gold shows the first pattern. The metal opened above $4,400 four days running, silver put in a six-week high on the same macro fuel last week, and the week's one red close arrived with a 2 percent oil excuse attached. Watch the pair, not the metal alone.
Flat. July producer prices printed 0.0 percent against a 0.2 percent consensus. Gold's rates engine got stronger on the very day it closed red.
Where we are wrong: gold falling on days oil doesn't
Here is the read, fully resolved. Gold's advance is mid-handoff from a war-hedge bid to a rates bid, and Thursday's fade was the old engine losing thrust faster than the new one spooled up. As long as the cooling-inflation regime holds, dips authored by the war premium are corrective events inside an intact trend, and the 9.5 percent month stays structurally alive.
And here is where we are wrong. If gold starts printing red closes on sessions when crude is flat or bid, the fades have lost their excuse, and the seller lives inside the metal itself. Pair that with a weekly close back below the shelf that held every open this week, while hike odds keep falling, and the thesis breaks: the handoff failed and distribution is underway.
That condition needs no model, and you can track it on any free chart. What it doesn't give you is the map between here and there, which levels along the way are noise and which one ends the trade. The next markers are the PCE release the Fed sees before September, the Iran-Oman talks, and every session where oil and gold disagree.
The bigger frame reaches past this week. The energy shock wrote the first half of 2026, and it put gold up 33 percent in a year as an inflation hedge with a war kicker. If the pipeline keeps cooling, the metal's ownership case rotates from crisis insurance toward a simple bet that the Fed stays put while real assets stay bid. Handoffs like that rarely resolve in one session, so the tape between now and the September meeting is the evidence that counts.
Know your entry, your exit, and where you are wrong on Gold
Thursday's oil-led fade is the surface signal. Gold is on the Kunkel Capital watchlist: the full research maps the current wave count to a defined entry zone, an exit target and the exact invalidation level, refreshed on a fixed rotation, with alerts when levels hit. €19.99 first month, then €34.99. Cancel anytime.
Frequently asked questions
Why did gold fall after the soft PPI report on August 13, 2026? Gold slipped 1.2 percent because crude oil fell harder, not because of the inflation data. Energy Secretary Chris Wright said Hormuz crude exports run near 9 million barrels a day, which drained part of the war premium that also supports gold's safe-haven bid. The rates side of the day was gold-positive.
Is a September Fed rate hike still likely after the July CPI and PPI prints? Futures pricing puts the odds under 35 percent, down from 55 percent a week earlier. Two cooling prints in 24 hours, CPI at 3.4 percent annual and PPI flat on the month, took the urgency out of a September move.
Does a red close on good news mean the gold rally is over? Not by itself. The reaction test asks whether the asset fell alone or alongside a correlated driver. Gold fell 1.2 percent while Brent fell 2.2 percent, which reads as driver rotation rather than distribution. Distribution would show gold falling on days oil holds.
What gold levels are worth watching right now? The market-visible shelf is the $4,400 area, where gold has opened four straight sessions, and below that the June base that anchors the whole advance. Model-derived confluence zones and the exact level that ends the setup sit in the Kunkel Capital research, not in public charts.
Sources: Bureau of Labor Statistics (July 2026 CPI and PPI releases), Bloomberg (Hormuz shipping and crude settlements), CME futures pricing for September rate odds.
Last updated: 2026-08-14